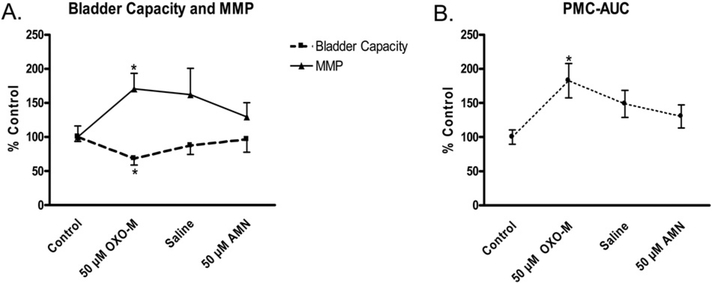
Fig. 4.
Changes in BC, maximal micturition pressure (MMP), and pre-micturition contraction–area under the curve (PMC-AUC) during a series of cystometrograms (2 ml/min, infusion rate) consisting of initial saline control followed by OXO-M (50 μM), second saline control and AMN (50 μM). OXO-M (50 μM) produced a statistically significant change in the three parameters compared to the initial saline controls (p < 0.05, repeated-measures ANOVA and Bonferroni’s multiple comparison test, n = 7–10 experiments). However, the measurements during second saline and AMN cystometrograms were not significantly different (p > 0.05) from those during OXO-M infusion

