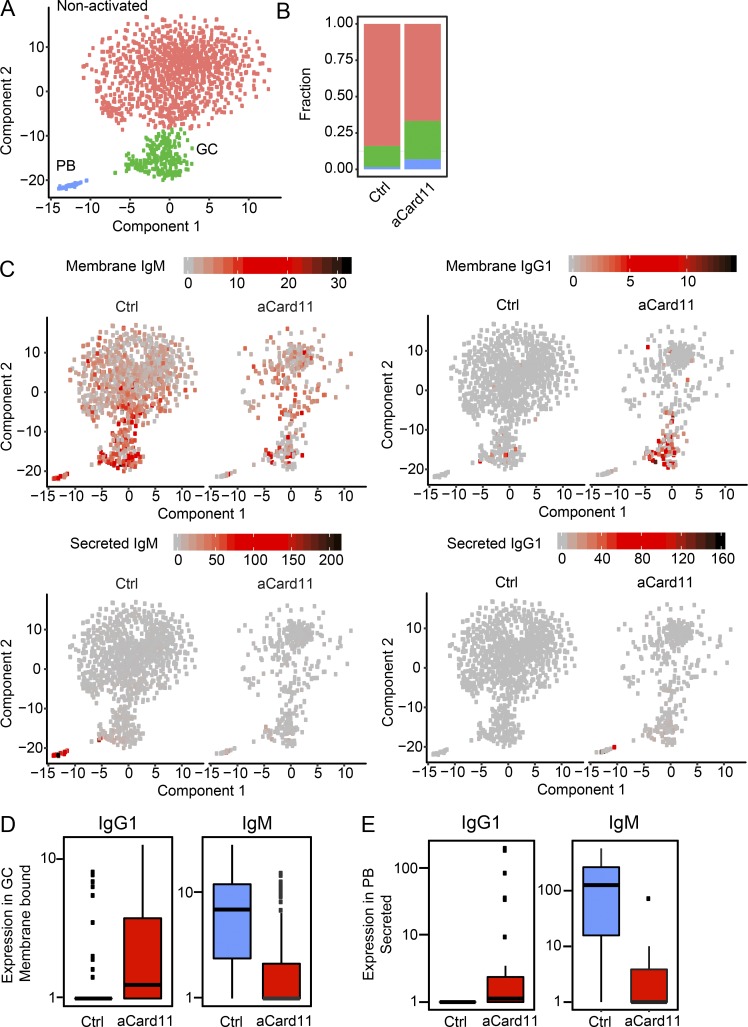
Figure 7.
aCARD11 promotes Ig class switching in GC B cells and generation of IgG1-secreting PCs. Ctrl (Mb1Cre/+) and Mb1-aCARD11 mice were immunized with SRBCs and sacrificed on day 5 after immunization for scRNA sequence analysis (see Materials and methods). (A) A t-SNE plot of 1,581 single B cells reveals three clusters: red, nonactivated; green, GC; and blue, PBs. (B) Fraction of B cell clusters in A within Ctrl and Mb1-aCard11 samples. (C) t-SNE plots of B cells (as shown in A) illustrating gene expression. Left: Ctrl cells; right: Mb1-aCard11. Depicted are transcript levels of membrane-bound IgM (upper left), secreted IgM (lower left), membrane-bound IgG1 (upper right), and secreted IgG1 (lower right). (D) Expression levels of membrane-bound IgG1 (left; P = 3.10−39) and IgM (right; P = 1.6 × 10−74) transcripts in GC B cells. (E) Expression levels of secreted IgG1 (left; P = 2.4 × 10−58) and IgM (right; P = 1.7 × 10−143) transcripts in GC B cells. (D and E) Blue, Ctrl; red, Mb1-aCard11. P values were calculated by using the likelihood ratio test included within Monocle’s differential-GeneTest function. Data shown are from one of two representative experiments. Graphs are box plots showing lower (first) and upper (third) quartiles with the line indicating the median. Lines extending from box plots indicate ±1.5 interquartile range (IQR). Individual data points are outlying points beyond ±1.5 IQR.

