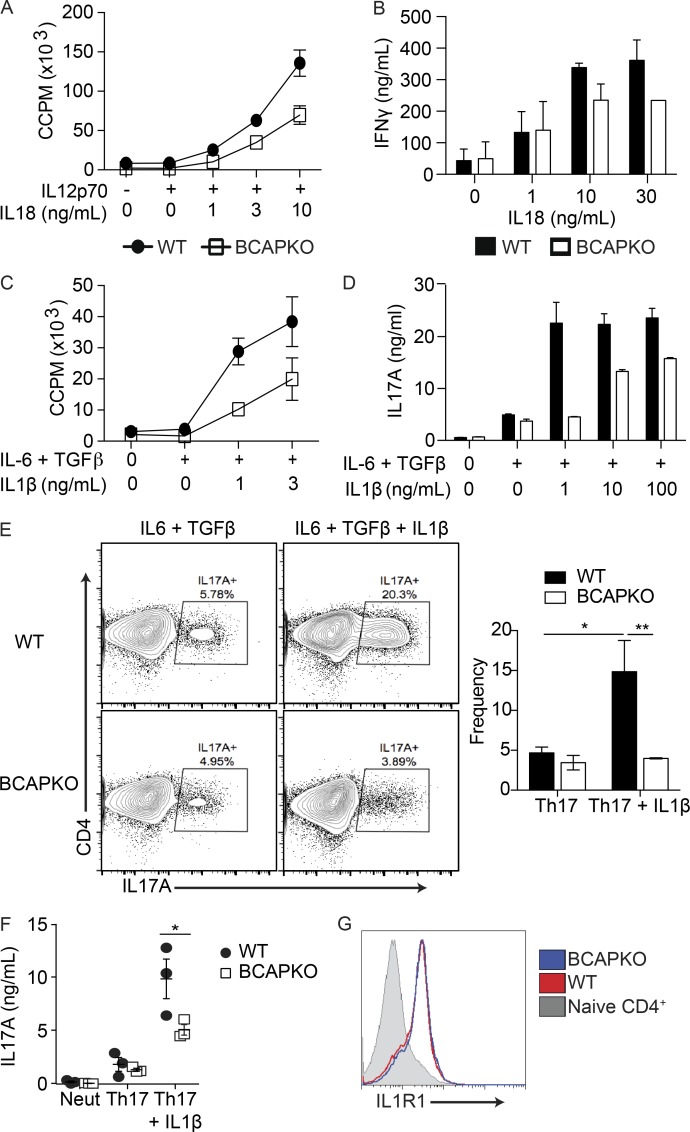
Figure 2.
BCAP functions downstream of IL-1R and IL-18R in CD4 T cells. (A and C) Naive WT and BCAPKO CD4+ T cells pooled from three mice were incubated with WT DCs (5:1), 3 ng/ml αCD3, and indicated cytokines. Proliferation was measured by 3H incorporation in the last 16 h of culture. Shown is the mean ± SD of three technical replicate cultures. Data are representative of two independent experiments. (B and D) IL-17A and IFN-γ measured from the supernatant of WT and BCAPKO DC/T cell cocultures (1:5) in the presence of the indicated cytokines. Shown is the mean ± SD of technical replicates. Data are representative of two independent experiments. (E) Representative flow plots (left) and quantification (right) of WT and BCAPKO naive CD4+ T cells polarized to Th17 with or without IL-1β for 5 d. Shown is the mean ± SEM; n = 3. *, P < 0.05, **, P < 0.01. Statistical analysis was performed with the two-tailed unpaired Student’s t test. (F) Naive WT and BCAPKO CD4+ T cells were polarized for 5 d using neutralizing conditions (αIFN-γ + αIL-4) or to Th17 cells (TGF-β + IL-6 + αIFN-γ + αIL-4) with or without IL-1β. After polarization, IL-17A secretion was measured by ELISA. Shown is the mean ± SD; n = 3. *, P < 0.05. (G) Naive WT and BCAPKO CD4+ T cells were polarized using neutralizing conditions; after 24 h, surface expression of IL-1R1 was measured using flow cytometry. Data are representative of three independent experiments.

