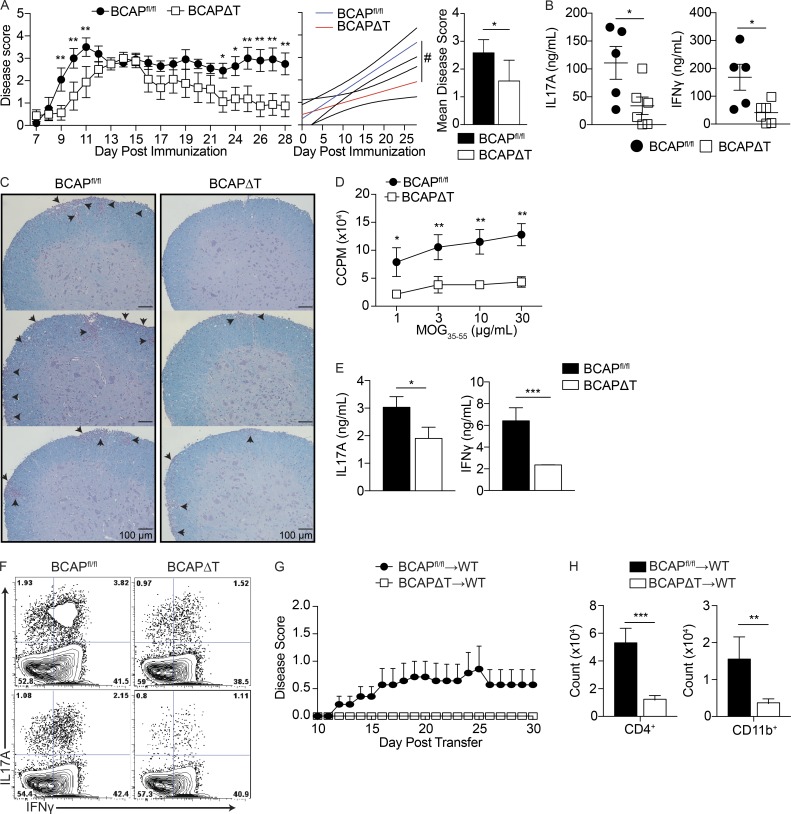
Figure 5.
BCAP is required for the generation of pathogenic Th17 cells. (A) Mean clinical scores ± SEM (left) of BCAPfl/fl and BCAPΔT mice immunized with MOG35-55 emulsified in CFA, with pertussis toxin given on days 0 and 2. Linear regression analysis of EAE disease progression for BCAPfl/fl (blue line) versus BCAPΔT (red line) mice (center). Mean clinical disease score ± SD (right) was calculated from clinical scores beginning at disease initiation (D7) to experimental end point (D28). *, P < 0.05; **, P < 0.01; #, P < 0.0001. Data shown are for four or five mice per group and are representative of four independent experiments. Statistical analysis was performed with the two-tailed unpaired Student’s t test. (B) Serum cytokine levels of BCAPfl/fl and BCAPΔT mice at day 16 after immunization for EAE were determined by ELISA. Shown is the mean ± SEM, n = 5 for BCAPfl/fl, and n = 6 for BCAPΔT. *, P < 0.05. Statistical analysis was performed with the two-tailed unpaired Student’s t test. (C) Luxol Fast Blue staining of spinal cords (10×) from BCAPfl/fl and BCAPΔT mice at day 16 after immunization for EAE. Images from three mice per genotype are shown. Arrows denote foci of cellular infiltration and/or demyelination. (D) CD4+ T cells were isolated from draining lymph nodes of MOG35-55-immunized BCAPfl/fl and BCAPΔT mice. Purified CD4+ T cells were incubated with WT DCs (10:1) and indicated concentrations of MOG35-55. Proliferation was measured by 3H incorporation in the last 16 h of culture. Shown is the mean ± SD; n = 3. *, P < 0.05; **, P < 0.01. Statistical analysis was performed with the two-tailed unpaired Student’s t test. (E) IL-17A and IFN-γ levels in the supernatant of DC–T cell cocultures as in D with 100 µg/ml MOG35-55, measured by ELISA. Shown is the mean ± SD; n = 3. *, P < 0.05; ***, P < 0.001. Statistical analysis was performed with the two-tailed unpaired Student’s t test. (F) Representative flow plots of CD4+CD44+ T cells from lymph nodes of EAE-immunized BCAPfl/fl and BCAPΔT mice. Shown are two independent mice per genotype. (G) Mean EAE clinical disease scores ± SEM of WT recipients of 5 × 10⁶ BCAPfl/fl and BCAPΔT CD4+ T cells primed in vivo with MOG35-55 emulsified in CFA and restimulated in vitro with WT DCs (1:5), 100 µg/ml MOG35-55, 10 ng/ml IL-1β, and 20 ng/ml IL-23 for 72 h. Data shown are for five to seven mice per group and are representative of two independent experiments. (H) Quantification of infiltrating CD4+ T cells and CD11b+ monocytes in the spinal cord of WT recipients of 5 × 10⁶ BCAPfl/fl and BCAPΔT CD4+ T cells as in G. Shown is the mean ± SEM, n = 7 for BCAPfl/fl and 5 for BCAPΔT. **, P < 0.01; ***, P < 0.001. Statistical analysis was performed with the two-tailed unpaired Student’s t test.

