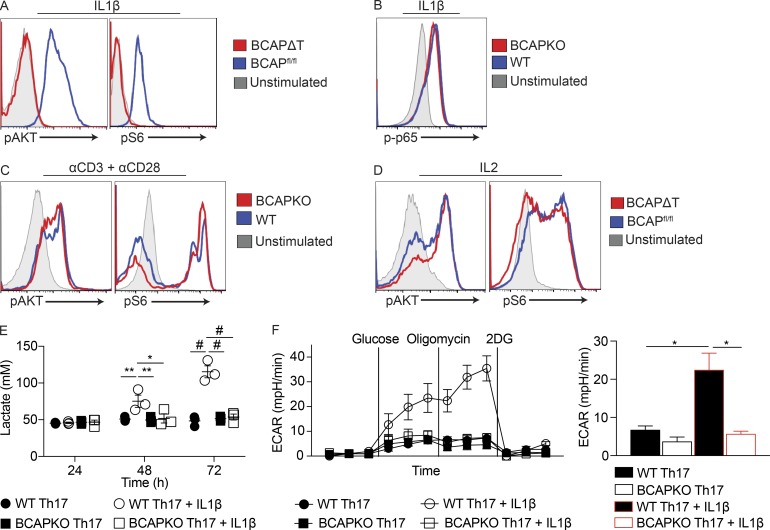
Figure 6.
IL-1β signals through BCAP to activate the mTOR pathway and increase glycolysis. (A–D) BCAP-deficient CD4+ T cells were stimulated with 10 ng/ml IL-1β (A and B), plate-bound αCD3 (5 µg/ml) + αCD28 (5 µg/ml; C), or 20 U/ml IL-2 (D). Cells were immediately fixed to 2% PFA and permeabilized with 100% methanol. After permeabilization, cells were analyzed for pAkt (S473), pS6 (S240/244), and p-p65 (S536). Data are representative of two (B) or three (A, C, and D) experiments. (E) Lactate was measured from the supernatant of naive WT and BCAPKO CD4+ T cells polarized to Th17 cells with irradiated (12 Gy) WT B cells (1:2), 30 ng/ml αCD3, and 10 ng/ml IL-1β as indicated. Shown is the mean ± SEM; n = 3. *, P < 0.05; **, P < 0.01; #, P < 0.0001. Statistical analysis was performed with the two-tailed unpaired Student’s t test. (F) Naive WT and BCAPKO CD4+ T cells were polarized to Th17 cells for 48 h, and then stimulated with 10 ng/ml IL-1β for 12 h as indicated and analyzed using the glycolysis stress test on the Seahorse platform. Left: The experimental time course. Right: The ECAR levels of each sample after the addition of oligomycin. Shown is the mean ± SEM; n = 3. *, P < 0.05. Statistical analysis was performed with the two-tailed unpaired Student’s t test.

