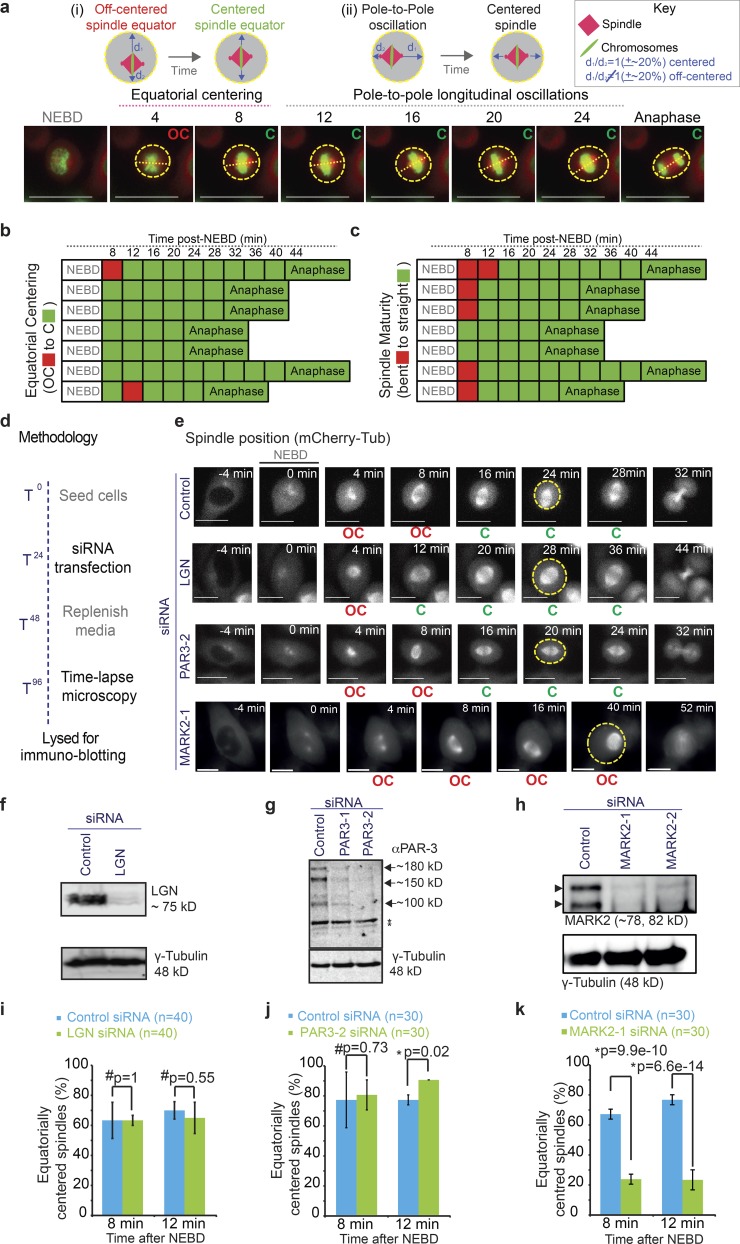
Figure 1.
Equatorial spindle centering is an early mitotic event that is dependent on MARK2, but not LGN or PAR3. (a) Top: Cartoons of mitotic spindle in either equatorially (i) or longitudinally (ii) off-centered (OC; left) versus centered (C; right) positions. Spindles were scored as off centered when the two distances (d1 and d2; marked by arrows) were unequal by >20%. Bottom: Time-lapse images of control siRNA–transfected HeLa His2B-GFP;mCherry-Tub cells acquired once every 4 min showing normal equatorial spindle centering before longitudinal centering and oscillation along the pole-to-pole axis. Outline of cell cortex identified using cytoplasmic signal of mCherry-tubulin is marked in yellow; pole-to-pole axis marked with a dashed line. Bars, 15 µm (b and c) Temporal evolution of spindle centering along the equatorial axis (b) and corresponding spindle maturation (from bent to straight bipolar spindle; c) in seven representative cells from videos acquired as shown in a. Boxes corresponding with sequential time frames in the video are colored either in red to indicate off-centered (b), or immature (c) spindles or in green to indicate centered (b) or mature (c) spindles. (d) Experimental regimen showing timeline of siRNA treatment followed by microscopy and lysate collection for immunoblotting to register protein depletion extent. (e) Time-lapse images of HeLa His2B-GFP;mCherry-Tub cells treated with control or LGN siRNA showing normal spindle centering but no oscillation of the mitotic spindle or Par3-2 siRNA showing normal centering of the mitotic spindle or MARK2-1 siRNA showing equatorially off centering of the mitotic spindle. Bars, 10 µm. (f–h) Blot showing depletion extent of LGN (f), PAR3 (g), or MARK2 (h) using one or two different siRNA oligonucleotides. (i–k) Graph of percentage of equatorially centered spindles at 8 or 12 min after NEBD in control or LGN siRNA–treated cells (i), control or PAR3-2 siRNA–treated cells (j), and control or MARK2-1 siRNA–treated cells (k) as assessed from time-lapse videos of HeLaHis2B-GFP;mCherry-Tub cells as shown in e. Note that post-siRNA transfection time-matched control siRNA data are used for graphs and immunoblots. Error bars refer to SEM values from three independent experiments. P-values showing significant (*) or insignificant (#) differences were calculated using a proportion test.

