Figure 5.
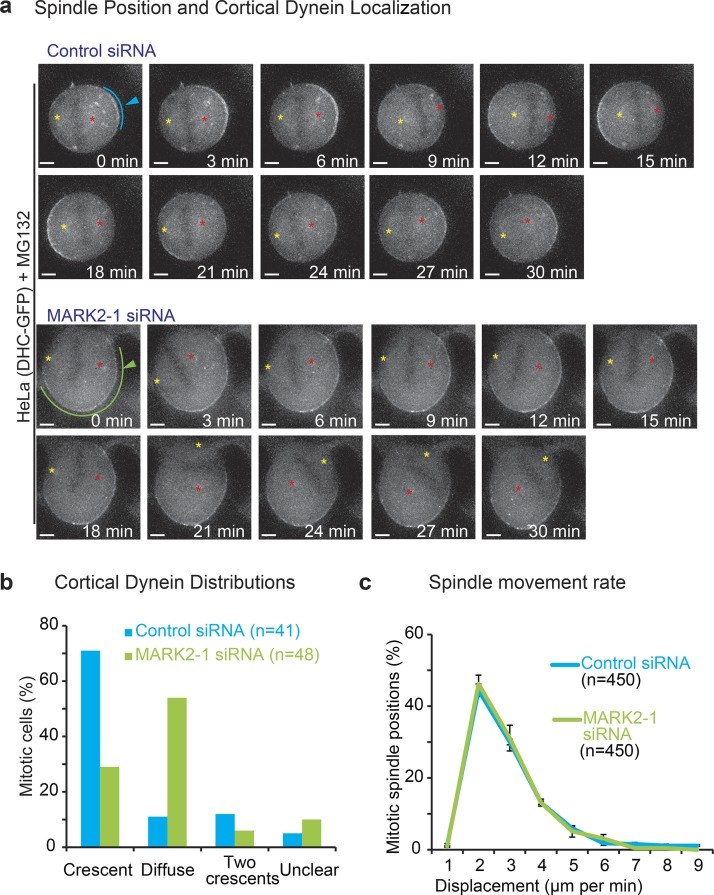
Cortical dynein distributions, but not spindle movement rates, are perturbed after MARK2 depletion. (a) Representative images of DHC-GFP signals in HeLaDHC-GFP cells treated with the indicated siRNA from time-lapse videos acquired once every minute. Cells were arrested at metaphase with MG132 treatment immediately before imaging. Spindle poles are marked with yellow and red asterisks to follow spindle movements. Blue and green arrowheads refer to crescent or diffuse DHC-GFP signals, respectively. Bars, 3 µm. (b) Bar graph shows frequency distributions of DHC-GFP localizations in cell treated with the indicated siRNA oligonucleotides. Data collated over three independent experiments. (c) Graph shows frequency distribution of spindle pole displacement in HeLa cells treated with MG132 immediately before imaging. Values are obtained from time-lapse videos obtained in a. n refers to spindle positions acquired from at least 15 cells for each RNAi condition from three independent experiments. Distances are measured from the spindle pole furthest away from the cortex in the first frame, with the distance measured each subsequent frame for that specific pole. Error bars show SEM.

