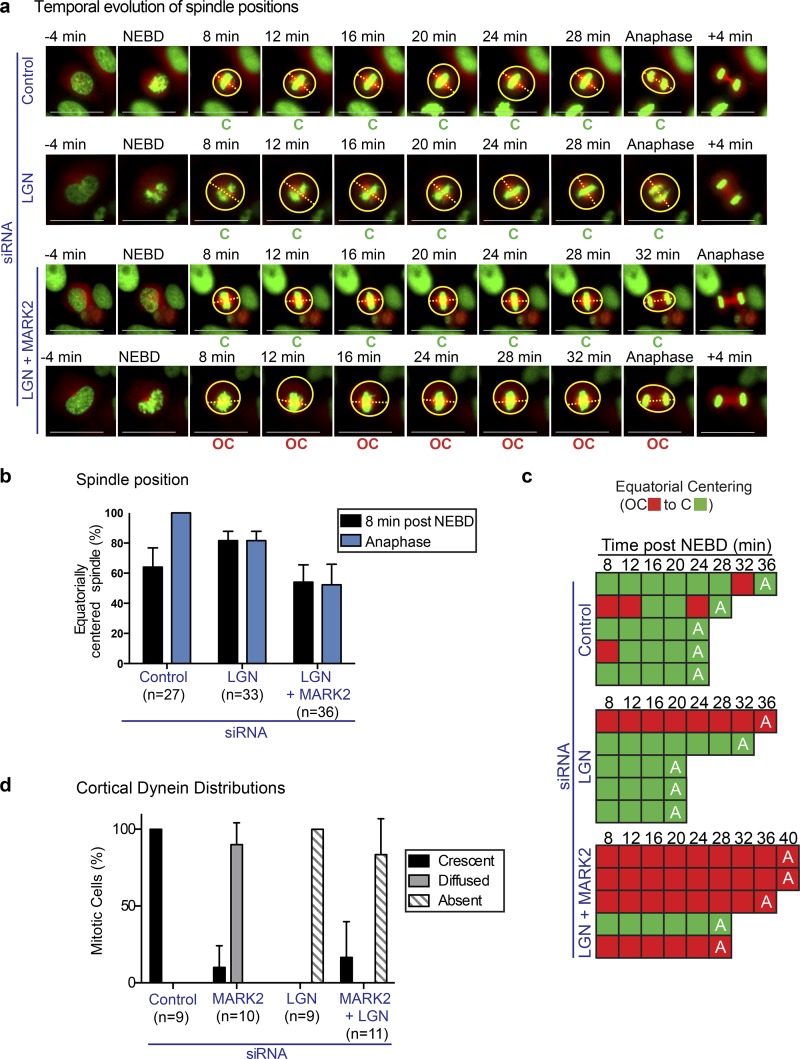
Figure 6.
Equatorial spindle off centering after MARK2 depletion is not caused by excessive pull by cortical dynein. (a) Representative time-lapse images of HeLaHis2B-GFP;mCherry-Tub cells treated with siRNA as indicated. Equatorially centered (C) and off-centered (OC) spindles are marked. mCherry-tubulin signal is used to outline cell cortex (circles) and pole-to-pole axis is marked with a dashed line. Bars, 15 μm. (b) Graph of percentage of equatorially centered spindles in cells treated with control or LGN with MARK2-1 siRNA as assessed from time-lapse videos as in a. Spindle positions 8 min after NEBD or at anaphase are reported. Error bars are SEM values across three experimental repeats. (c) Temporal evolution of spindle positions in five representative cells, treated with siRNA as indicated assessed from time-lapse videos as in a. A, anaphase. Red and green boxes indicate equatorially off-centered and centered spindle states, respectively. (d) Bar graph shows frequency distributions of DHC-GFP localizations in HeLaDHC-GFP cells treated with the indicated siRNA oligonucleotides as assessed from time-lapse videos acquired once every minute. Error bars are SEM values from data collated over three independent experiments.

