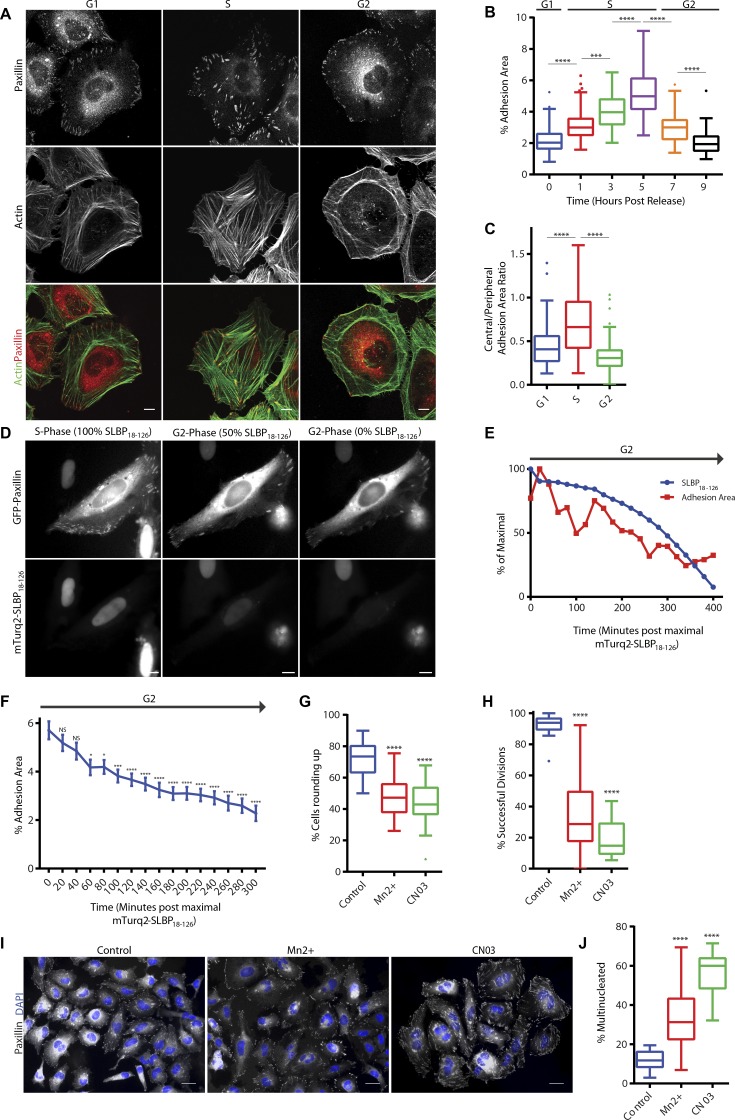
Figure 1.
Adhesion complex area is modified in a cell cycle–dependent manner. (A) Immunofluorescence images of cells in G1, S, and G2 phase stained for adhesion marker paxillin and actin. (B) Quantification of adhesion complex area per cell over a period of 0- to 9-h release after double-thymidine block. A minimum of 61 cells per condition was used for analysis. (C) Quantification of ratio of central adhesion complex area (adhesion complex area >3 µm from cell periphery) to peripheral adhesion complex area (adhesion complex area <3 µm from cell periphery) of cells in G1, S, and G2 phase. A minimum of 56 cells per condition was used for analysis. (D) Fluorescence images of a HeLa cell expressing mTurq2-SLBP18-126 and GFP-paxillin illustrating progressive loss of mTurq2-SLBP18-126. (E) Quantification of GFP-paxillin adhesion area and mTurq2-SLBP18-126 intensity changes over a time period of 400 min for an individual cell illustrating loss of mTurq2-SLBP18-126 and associated decrease in adhesion area. (F) Quantification of GFP-paxillin adhesion complex area in cells after degradation of mTurq2-SLBP18–126 and progression through G2. A total of 30 cells was used for analysis. (G and H) Quantification of a HeLa cell rounding and successful division after Mn2+ or CN03 treatment. A minimum of 2,483 cells per condition was used for analysis. (I) Immunofluorescence images of synchronized HeLa cells treated with Mn2+ or CN03 that have progressed through a single division stained for paxillin and with DAPI. Bars: (A and D) 10 µm; (I) 20 µm. (J) Quantification of HeLa cell multinucleation after treatment with Mn2+ or CN03. A minimum of 384 cells per condition was used for analysis. Results in B, C, G, H, and J are displayed as Tukey box and whisker plots (whiskers represent 1.5× interquartile range) and are for at least three biological replicates. *, P < 0.05; ***, P < 0.001; ****, P < 0.0001.

