Figure 2.
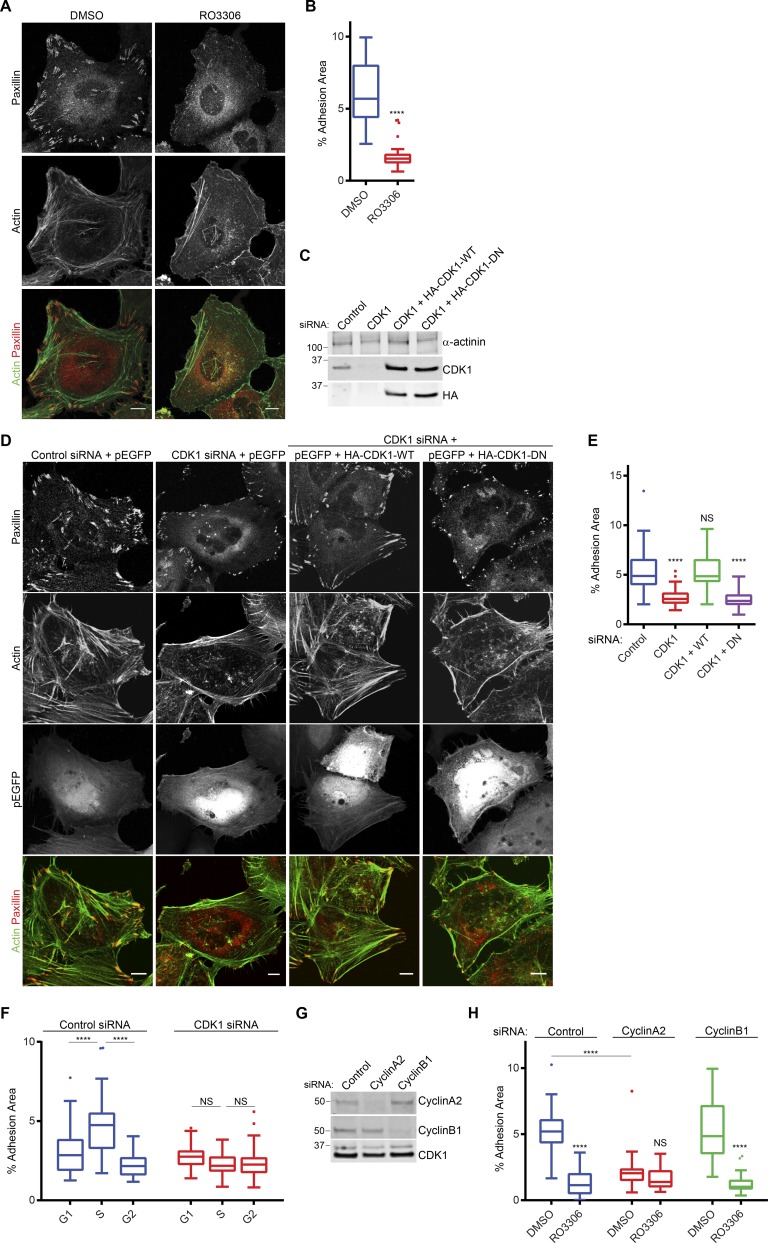
CDK1 kinase activity maintains adhesion complexes. (A) Immunofluorescence images of cells plated on glass coverslips for 48 h and then treated with either DMSO or CDK1 inhibitor RO3306 for 1 h and stained for paxillin and actin. (B) Quantification of adhesion complex area per cell of DMSO or RO3306 treated cells. A minimum of 32 cells per condition was used for analysis. (C) Western blot showing knockdown of endogenous CDK1 and expression of HA-tagged CDK1. (D) Immunofluorescence images of GFP-positive control, CDK1-knockdown cells, and CDK1-knockdown cells reexpressing WT or dominant-negative CDK1 stained for paxillin and actin. (E) Quantification of adhesion area per cell after CDK1 knockdown and reexpression. A minimum of 48 cells per condition was used for analysis. Bars, 10 µm. (F) Quantification of changes in adhesion area per cell in G1, S, and G2 phase for control and CDK1-knockdown cells. A minimum of 36 cells per condition was used for analysis. (G) Western blot showing knockdown of endogenous cyclin A2 and cyclin B1. Molecular masses are given in kilodaltons. (H) Quantification of adhesion complex area per cell in control, cyclin A2–, or cyclin B1–knockdown cells treated with DMSO or RO3306. A minimum of 36 cells per condition was used for analysis. Results in B, E, F, and H are displayed as Tukey box and whisker plots (whiskers represent 1.5× interquartile range) and are for at least three biological replicates. *, P < 0.05; ****, P < 0.0001.

