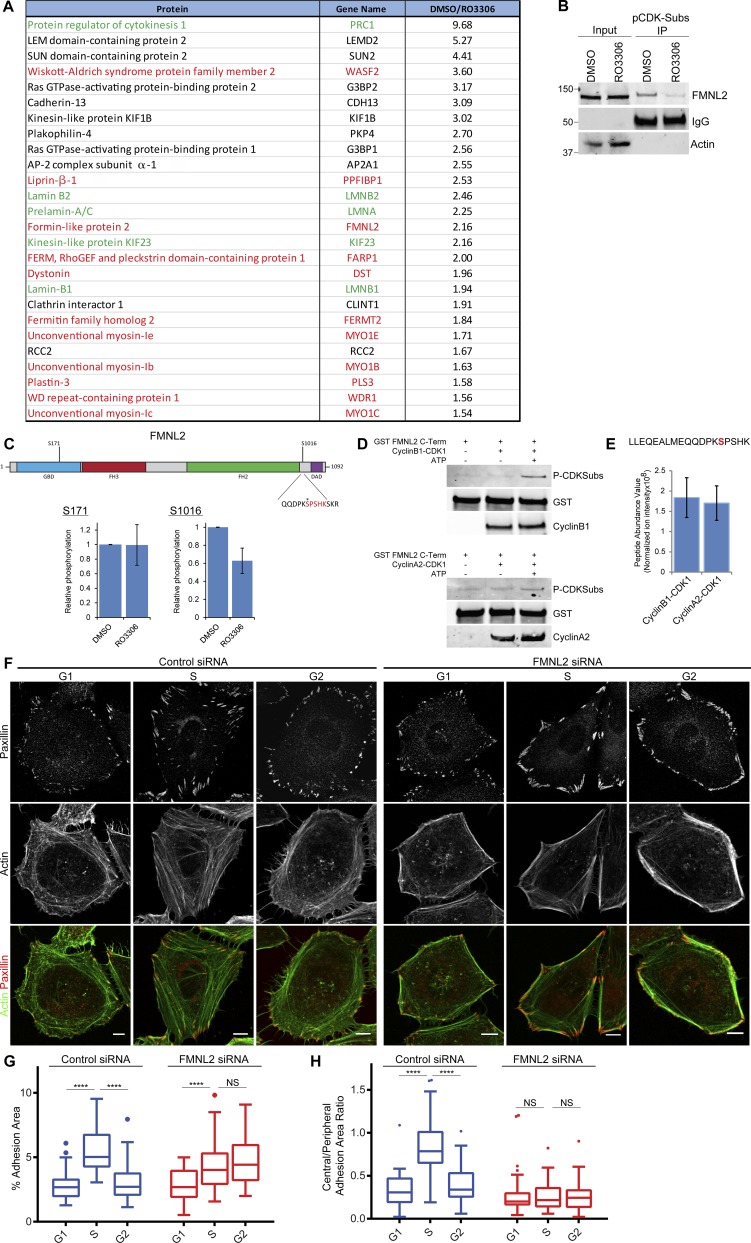
Figure 3.
FMNL2 is a CDK1 substrate required for cell cycle–dependent modification of adhesion complexes. (A) MS identification of CDK1 substrates showing CDK1-dependent phosphorylated proteins from interphase cells. Proteins highlighted in green are known CDK1 substrates, and those in red are linked to regulation of adhesion complexes and actin. (B) Immunoprecipitation (IP) of anti-CDK/MAPK substrate antibody and Western blot of FMNL2 from DMSO- or RO3306-treated cells. (C) Schematic diagram of FMNL2 phosphorylation sites found by quantitative MS after treatment with RO3306. Asterisk indicates serine1016 site of phosphorylation. (D) Western blots showing phosphorylation of a C-terminal fragment of FMNL2 by purified cyclin A2–CDK1 or cyclin B1–CDK1. Molecular masses are given in kilodaltons. (E) MS identification of a single phosphopeptide corresponding with S1016 after in vitro phosphorylation of a C-terminal fragment of FMNL2 by purified cyclin A2–CDK1 or cyclin B1–CDK1. (F) Immunofluorescence images of control or FMNL2-knockdown cells in G1, S, and G2 phase stained for adhesion marker paxillin and actin. Bars, 10 µm. (G) Quantification of adhesion area changes in G1, S, and G2 phase for control and FMNL2-knockdown cells. A minimum of 45 cells per condition was used for analysis. (H) Quantification of ratio of central adhesion complex area (adhesion complex area >3 µm from cell periphery) to peripheral adhesion complex area (adhesion area <3 µm from cell periphery) in G1, S, and G2 phase for control and FMNL2-knockdown cells. A minimum of 40 cells per condition was used for analysis. Results in C and E are displayed as bar graphs ± SEM and in G and H as Tukey box and whisker plots (whiskers represent 1.5× interquartile range) and are for at least three biological replicates. ****, P < 0.0001.

