Figure 5.
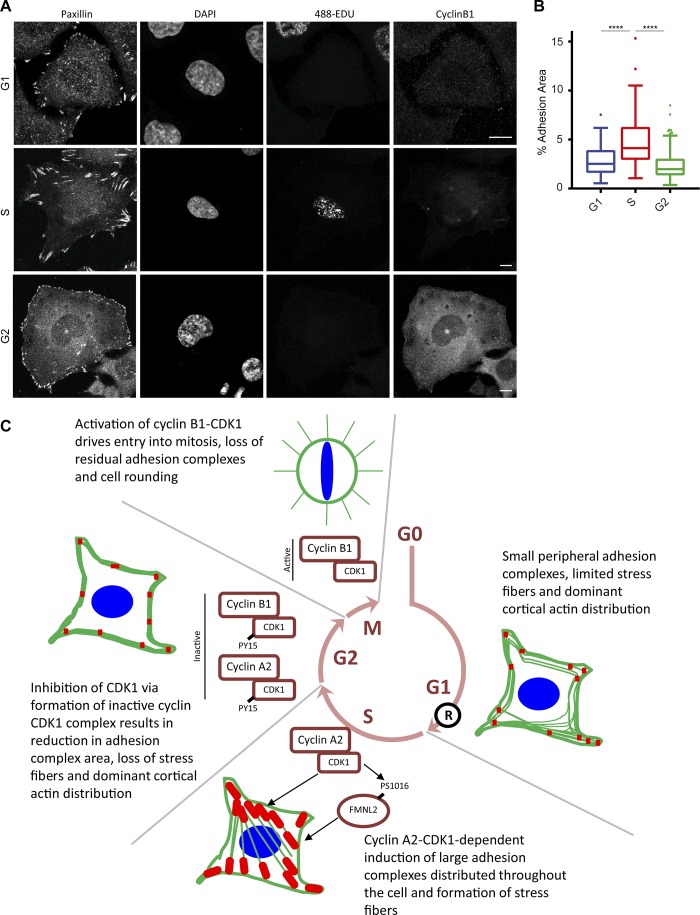
Adhesion area in asynchronous cells varies depending on cell cycle phase. (A) Immunofluorescence images of asynchronous cells pulse-labeled with EDU and then stained for paxillin and cyclin B1. G1 cells were defined as EDU and cyclin B1 negative, S cells were EDU positive, and G2 cells were cyclin B1 positive. Bars, 10 µm. (B) Quantification of adhesion complexes in asynchronous cells segregated into G1, S, and G2 as defined in A. A minimum of 106 cells per condition was used for analysis. (C) Schematic diagram of model presented in this paper. Cellular focal adhesion area changes as cells progress through the cell cycle, with an initial cyclin A2–CDK1-dependent increase in adhesion area and stress fibers in S phase being observed. In G2, inhibition of CDK1 after association with cyclin B1 and phosphorylation by Wee1 results in a reduction in focal adhesion area and stress fibers. Residual focal adhesions are subsequently disassembled after activation of cyclin B1–CDK1, entry into mitosis, and mitotic cell rounding. Results in B are displayed as Tukey box and whisker plots (whiskers represent 1.5× interquartile range) and are for at least three biological replicates. ****, P < 0.0001.

