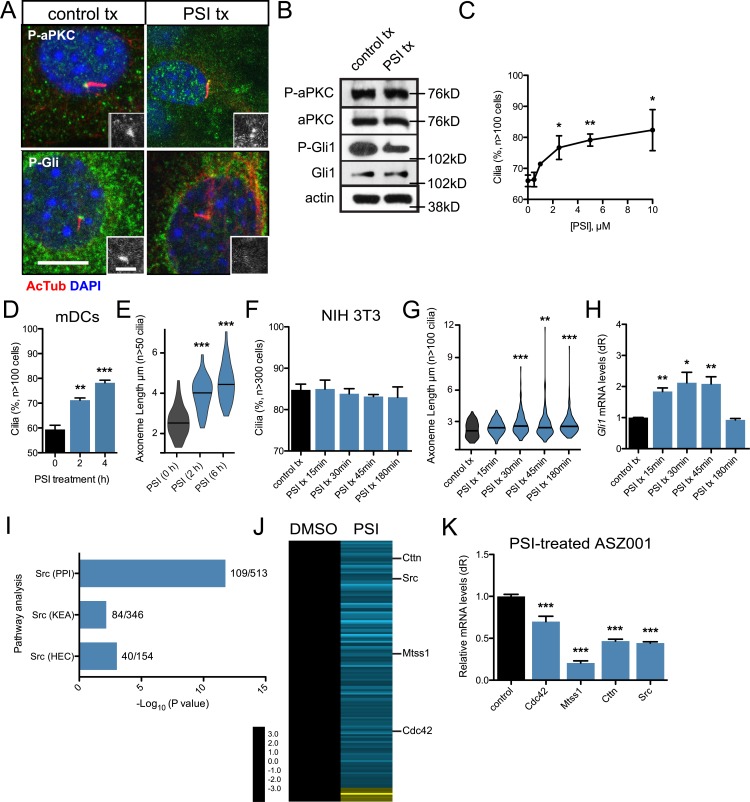
Figure 4.
aPKC activity is necessary to regulate primary cilia frequency and axoneme length. (A) Immunofluorescence of control-treated or 10 µM PSI–treated mDCs stained for phosphorylated aPKC (P-aPKC), phosphorylated Gli1 (P-Gli), and primary cilia (AcTub). Immunoreactivity around the basal body is highlighted in the lower right of each panel. tx, treatment. Bars: 10 µm; (inset) 2 µm. (B) Western blot of control or PSI-treated mDCs that are probed for aPKC, P-aPKC, Gli1, P-Gli1, and actin. (C and D) Percentage of subconfluent mDCs with primary cilia upon dose-dependent (C; n = 2 experiments) or temporal addition of 10 µM PSI (D; n = 3 experiments). (E) Violin plot of axoneme length upon temporal addition of 10 µM PSI. (F and G) Percentage of cells displaying primary cilia (F) and violin plot of axoneme lengths (G) from confluent NIH 3T3 cells after treatment with 10 µM PSI for the indicated amounts of time (n = 3 experiments). (H) Gli1 mRNA levels of confluent NIH 3T3 cells treated with Shh-CM and 10 µM PSI for the indicated amounts of time (n = 3 experiments). dR, delta reporter signal normalized to passive reference dye. (I) Pathway analysis of down-regulated transcripts in PSI-treated ASZ001 cells compared with DMSO control. Number of genes in dataset compared with total number of genes displayed as a fraction to the right of each bar. KEA, kinase enrichment analysis; PPI, protein–protein interaction database. Human endogenous complexome, HEC. (J) Heat map of significantly changed transcripts in the Src pathway in PSI-treated ASZ001 cells compared with DMSO control. (K) Quantitative reverse-transcription PCR validation of selected components of the Src pathway in PSI-treated ASZ001 cells compared with DMSO control (n = 3 experiments). Error bars represent SEM. Significance determined by unpaired two-tailed t test (*, P < 0.05; **, P < 0.01; ***, P < 0.001).

