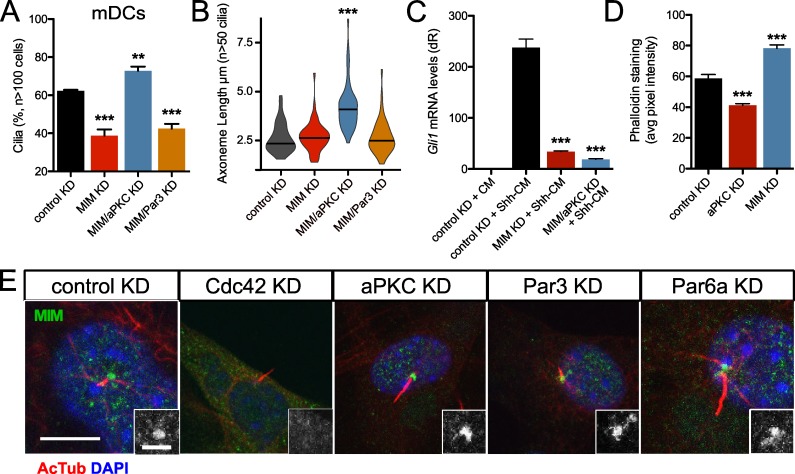
Figure 5.
aPKC antagonizes MIM downstream of Cdc42. (A and B) Percentage of subconfluent mDCs displaying primary cilia (A) and violin plot of axoneme length (B) after shRNA knockdown (KD) of control (n = 4 experiments), MIM (n = 7 experiments), aPKC and MIM (n = 7 experiments), or Par3 and MIM (n = 3 experiments). (C) Gli1 mRNA levels of confluent mDCs after shRNA knockdown of control (n = 9 experiments), MIM (n = 3 experiments), or aPKC and MIM (n = 3 experiments) and treated with control-conditioned media or Shh-CM. CM, conditioned media. dR, delta reporter signal normalized to passive reference dye. (D) Phalloidin staining quantification of subconfluent mDCs after shRNA knockdown of control, aPKC, or MIM (n > 50 cells). Error bars represent SEM. Significance was determined by unpaired two-tailed t test (**, P < 0.01; ***, P < 0.001). (E) Immunofluorescence of control, aPKC, Par6a, Cdc42, or Par3 knockdown mDCs stained for MIM and acetylated-tubulin (AcTub)–positive primary cilia. MIM staining around the basal body is highlighted in the lower right of each panel. Bars: 10 µm; (inset) 2 µm.

