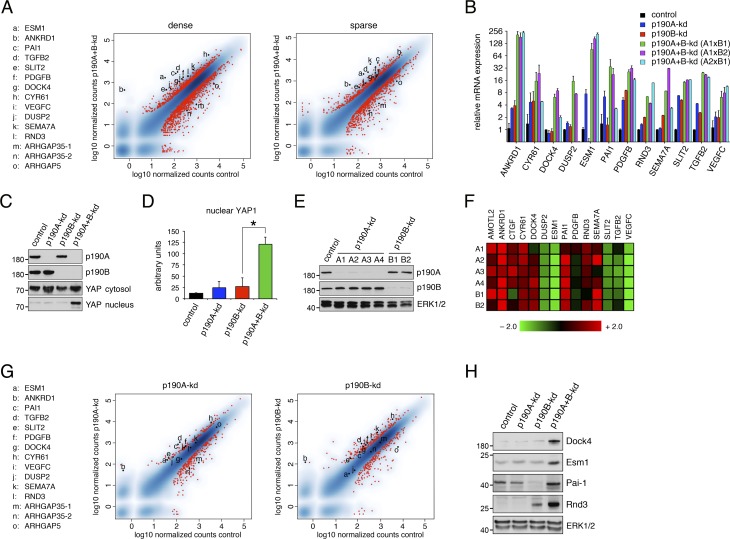
Figure 4.
p190A and p190B repress expression of genes associated with the Hippo pathway. (A) Genome-wide mRNA-seq analyses from MDCK cells depleted of p190A and p190B expression reveal strong induction of genes associated with Hippo signaling in both dense and sparse cultures. The data are represented as x–y plots with relative gene expression levels in control cells and p190A+B-kd cells on the abscissa and ordinate, respectively. Red dots correspond with individual genes with differential gene expression between p190A+B-kd and control cells using a threshold of log2(fold change) ≥1 and adjusted P value ≤0.05. Genes selected for further validation as well as ARHGAP35 (two splice forms) and ARHGAP5 genes encoding p190A and p190B, respectively, are listed as a–o and marked individually as black dots. (B) Validation of transcriptomes from dense cultures of control, p190A-kd, p190B-kd, and p190A+B-kd cells by qPCR analysis. p190A and p190B depletion was achieved by three distinct combinations of shRNAs targeting p190A and p190B. Data are presented as mean ± SD (n = 3). (C) Knockdown of p190A and p190B promotes nuclear accumulation of YAP as determined by Western blotting to detect YAP1 in the nuclear fractions as well as p190A, p190B, and total YAP1 in the cytosolic fraction. (D) Quantification of nuclear YAP1 levels in dense cultures of control, p190A-kd, p190B-kd, or p190A+B-kd cells. Data are presented as mean ± SD (n = 4); *, P < 0.02. (E) Depletion of p190A or p190B in HEC-1-A uterine carcinoma cells as determined by Western blotting to detect p190A, p190B, and ERK. (F) Heat map representing relative fold change (linear scale) in gene expression levels in HEC-1-A cells depleted of p190A or p190B. Four distinct shRNAs (A1–A4) targeting p190A and two distinct shRNAs (B1 and B2) targeting p190B were used in this experiment. (G) Transcriptomes from MDCK cells depleted of either p190A or p190B expression show modest induction of Hippo-associated genes relative to control cells. The data are presented as described in A. Knockdown of either p190A or p190B expression was induced for 3 d at sparse cell density followed by replating at high cell density and continued culture for another 3 d, after which gene expression analysis was performed. The red dots correspond with individual genes with differential gene expression between p190A-kd or p190B-kd and control cells using a threshold of |log2(fold change)| ≥1 and adjusted P value ≤0.05. Genes are listed as a–o and marked individually as described in A. (H) Validation of gene expression elicited by depletion of p190A and/or p190B by Western blotting using antibodies specific for Dock4, Esm1, Pai-1, and Rnd3 with ERK1/2 as control for equal protein loading. Molecular masses are given as kilodaltons.

