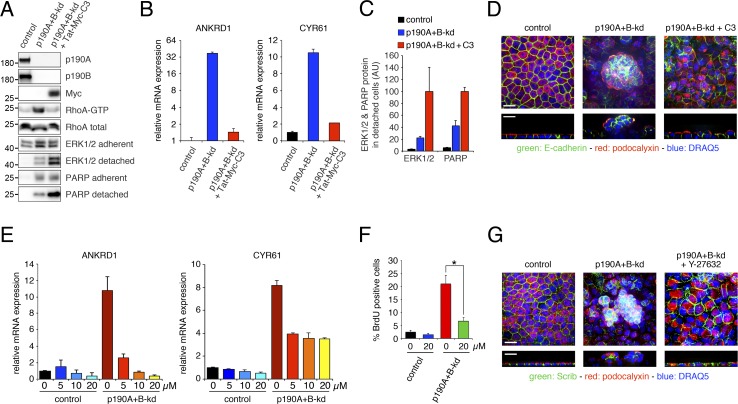
Figure 7.
Rho–ROCK signaling promotes YAP-mediated gene transcription and loss of CIP in cells depleted of p190A and p190B. (A) Delivery of Tat-Myc-C3 transferase (Tat-Myc-C3) protein to p190A+B-kd cells. Control or p190A+B-kd cells were incubated with estimated equal amount of GST only or cleaved Tat-Myc-C3 for 18 h. Western blotting of whole-cell lysates was performed to detect Tat-Myc-C3 protein as well as p190A, p190B, RhoA, ERK1/2, and cleaved PARP fragment. Lysates of detached cells and cellular fragments were processed for Western blotting to detect ERK1/2 and cleaved PARP fragment. Moreover, RBD pulldown was performed to detect levels of Rho-GTP in parallel cultures. Molecular masses are given as kilodaltons. (B) qPCR analysis of ANKRD1 and CYR61 expression in control and p190A+B-kd cells with or without uptake of Tat-Myc-C3 protein. Data are presented as mean ± SD (n = 3). (C) Quantification by densitometry of relative amounts of ERK1/2 and cleaved PARP protein in medium harvested from control and p190A+B-kd cells incubated with GST only or cleaved Tat-Myc-C3. (D) Confocal microscopy of control and p190A+B-kd cells with or without incubation with Tat-Myc-C3 protein. Cells were labeled to detect E-cadherin (green) and podocalyxin (red), and nuclei were stained with DRAQ5 (blue). (E) qPCR analysis of mRNA levels in control and p190A+B-kd cells treated with 0–20 µM ROCK inhibitor Y-27632 for 24 h. (F) BrdU incorporation in control or p190A+B-kd cells incubated with 0 or 20 µM Y27632 for 3 d at low cell density followed by 5 d at high cell density. Data are presented as mean ± SD (n = 4); *, P < 0.02. (G) Confocal microscopy of control and p190A+B-kd cells as well as p190A+B-kd cells treated with 20 µM Y-27632 during 5 d of culturing on permeable supports. Bars, 10 µm.

