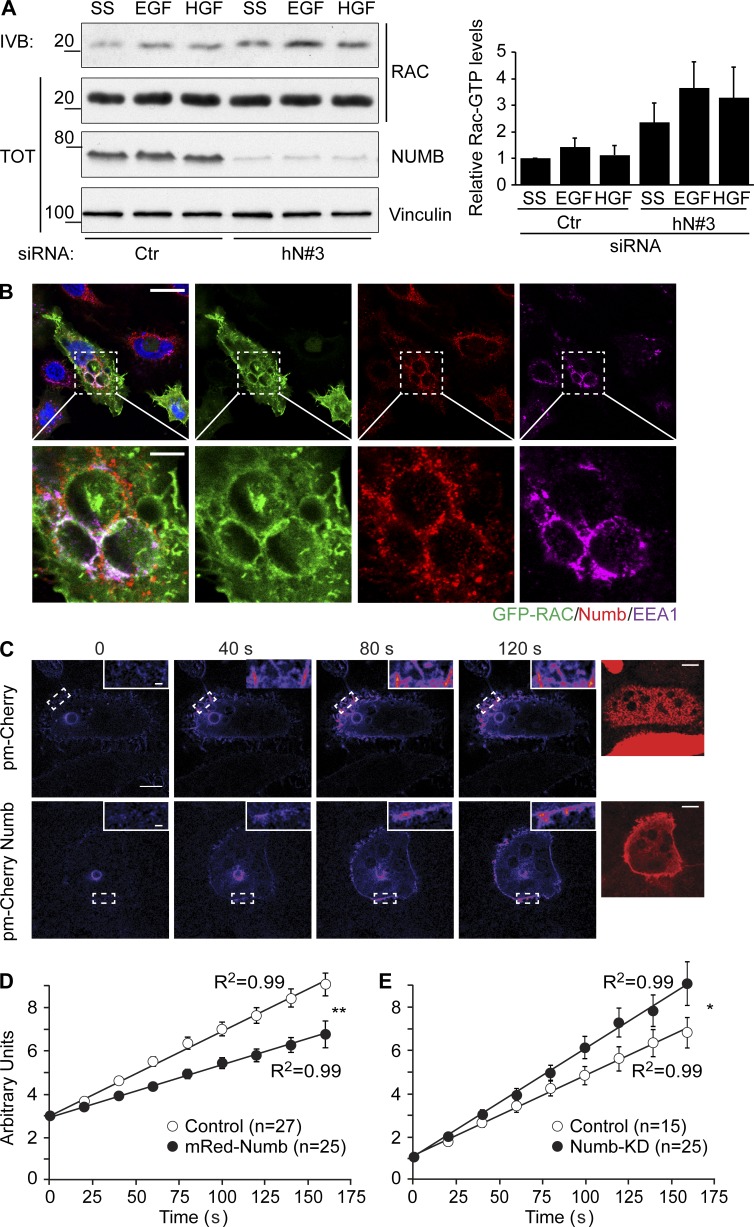
Figure 9.
Loss of NUMB increases RAC-GTP levels and RAC1 recycling. (A) HeLa cells transfected with siRNA against human NUMB (hN#3) or scrambled oligo (Ctr) as control were serum starved (SS) for 2 h and stimulated with either 100 ng/ml EGF (8 min) or 100 ng/ml HGF (7 min) as indicated. Equal amounts of cell lysate were immunoprecipitated with GST-CRIB. Total lysates (TOT) and bound material (IVB) were analyzed by IB with the indicated antibody. MW markers are on the left in kilodaltons. Right graph: quantification of the relative RAC1-GTP levels. The relative intensity of each RAC1-GTP band was normalized to the total amount of RAC1. Data are the mean ± SD of three independent experiments. (B) Confocal analysis of HeLa cells cotransfected with GFP-RAC1 and RAB5, which induces the formation of enlarged endosomes. Cells were fixed and processed for epifluorescence analysis to visualize GFP-RAC (green) or stained with specific antibodies or with DAPI to visualize NUMB (red), EEA1 (magenta), or nuclei (blue), respectively. Bar, 20 μm. Lower panels: magnifications of the indicated regions. Bar, 5 μm. (C) HeLa cells were cotransfected with photoactivatable paGFP RAC and pmCherry-NUMB or empty vector. paGFP barely absorbs 488 nm light in its native form, thereby exhibiting a weak fluorescence emission. Focal plane–restricted, multiphoton-induced photoactivation of paGFP-RAC was achieved by exciting the area corresponding to a vesicle. Images were then collected every 20 s (exciting fluorescence at 488 nm). Insets, 3× magnifications of the indicated areas. Right panels: NUMB Red epifluorescence images are shown. Bars, 10 μm. (D) The increase in mean fluorescence over time in a target region of the PM adjacent to the photoactivatable vesicle. The data are the mean ± SEM of 27 and 25 events counted for the empty vector (control) and NUMB (pmCherry-NUMB) transfected cells, respectively. (E) The increase in mean fluorescence over time in a target region of the PM adjacent to the photoactivatable vesicle. The data are the mean ± SEM of 15 and 18 events counted for cControl and NUMB KD cells, respectively. An ANOVA F-test was used to calculate P values of the different slope: **, P < 0.005; *, P < 0.05.

