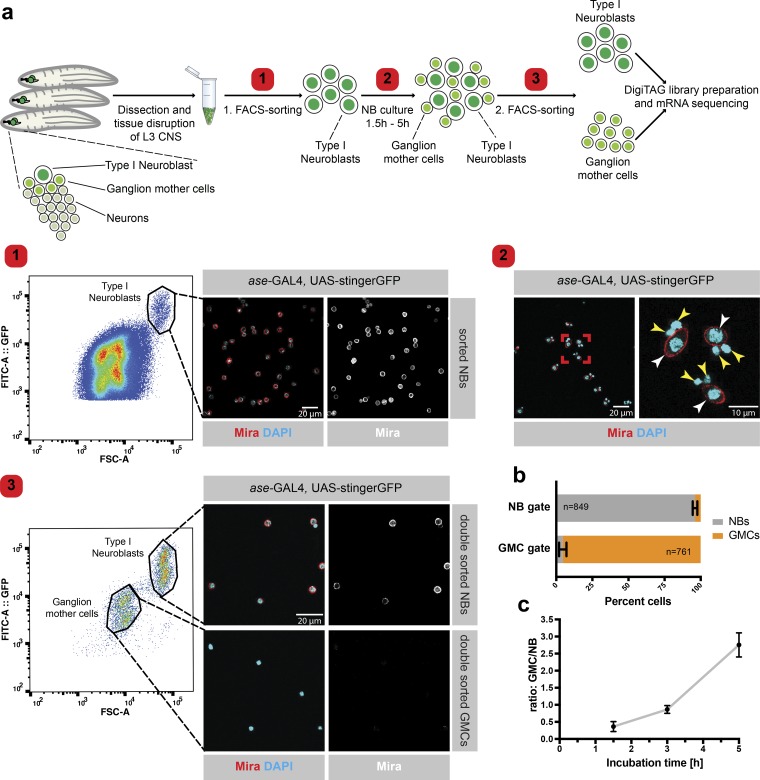
Figure 1.
Pure populations of larval NBs and GMCs of different ages can be obtained by FACS. (a) Larval central nervous systems (CNS) expressing a nuclear GFP in a type I NB–specific manner (ase-GAL4 and UAS-stingerGFP) were dissected and the tissue was disturbed into a single-cell solution. NBs were sorted according to cell size and GFP intensity (step 1) and were cultured in Schneider’s medium for 1.5, 3, or 5 h (step 2); white arrowheads indicate NBs, and yellow arrowheads indicate GMCs. The mixture of NBs and newly formed GMCs was subjected to a second FACS sort, displaying two clearly distinct cell populations in the FACS plot. The population containing large cells with a high GFP intensity signal comprises NBs (Mira+), whereas the small cells with the low GFP signal intensity are GMCs. The FACS plot is a representative example of the second FACS sort after 3 h of NB culture (step 3). By using a GAL4 strain harboring both heterozygous and homozygous GAL4 and UAS-stingerGFP, we were able to separate two NB and two GMC populations when plotting the strength of the GFP signal to the size of the cells (forward scatter [FSC]-A). Both subpopulations are equal in size but different in the strength of the GFP signal as heterozygous insertions result in weaker GFP signals than homozygous insertions. (b) Essentially pure populations of NBs and GMCs were obtained after the second FACS sort. n (NB gate) = 849 cells, n (GMC gate) = 761 cells. (c) Increased incubation time between the two consecutive FACS sorts resulted in an increased GMC/NB ratio. n ≥ 3 Experiments. Error bars represent mean ± SD.

