Figure 1.

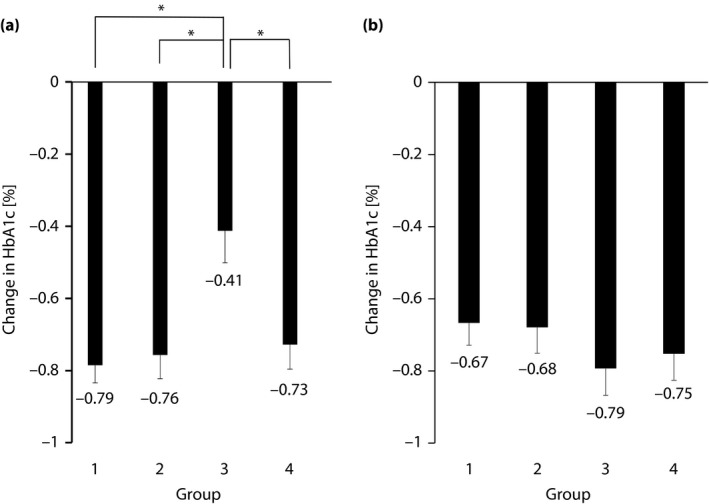
Degree of change in hemoglobin A1c (HbA1c) after starting sitagliptin. (a) At 3 months. Mean ± standard error, *P < 0.05 (groups compared using the Tukey–Kramer method). (b) At 12 months. Mean ± standard error, not significant.

Degree of change in hemoglobin A1c (HbA1c) after starting sitagliptin. (a) At 3 months. Mean ± standard error, *P < 0.05 (groups compared using the Tukey–Kramer method). (b) At 12 months. Mean ± standard error, not significant.