Figure 1.

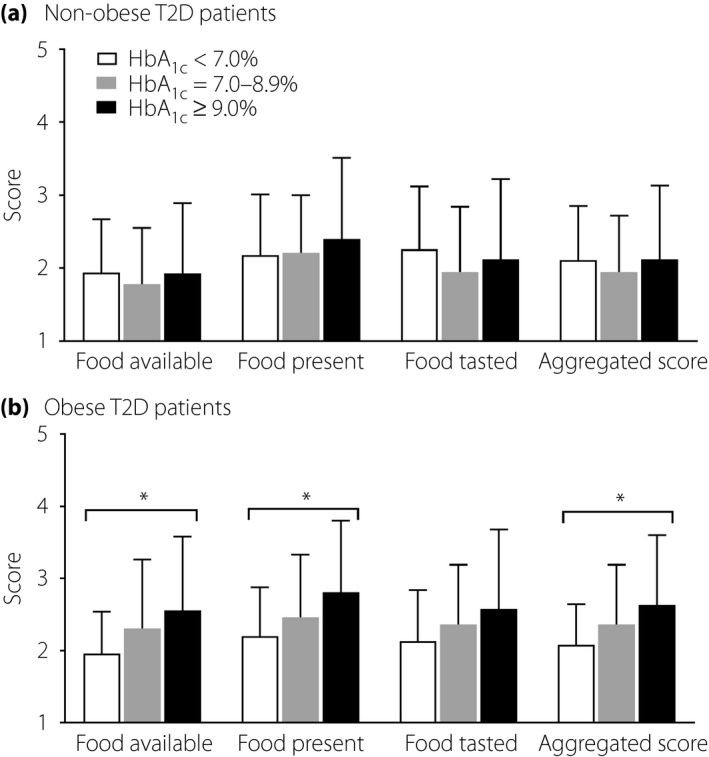
The mean (±standard deviation) Power of Food Scale (PFS) aggregated, subscale ‘food available,’ ‘food present’ and ‘food tasted’ scores for (a) 105 non‐obese and (b) 106 obese type 2 diabetes patients stratified according to glycemic status. *P < 0.05 after adjustment for age, sex, disease duration of diabetes and insulin use.
