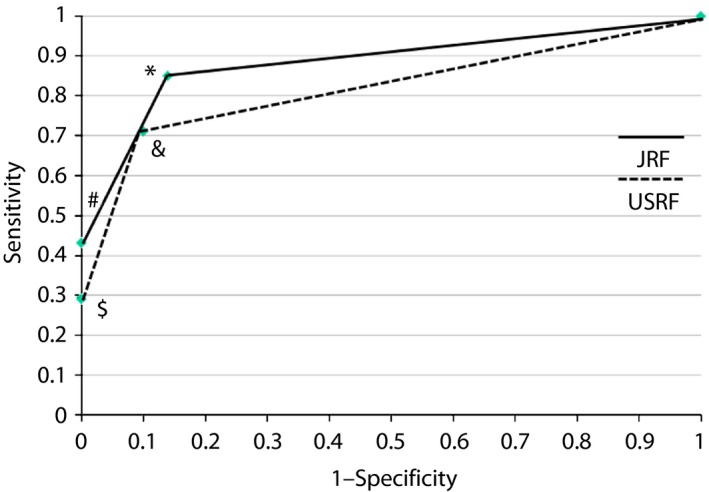
Figure 2.

Receiver operating characteristic curve showing the validity of nerve conduction abnormalities (NCAs) assessed by DPNCheck to diagnose ‘probable DSPN.’ The solid line is a line connecting the sensitivity ‘1‐specificity’ coordinate points of NCA1 (*) and NCA2 (#) determined by the Japanese regression formula (JRF). Similarly, the broken line is a line connecting the sensitivity – ‘1‐specificity’ coordinate points of NCA1 (&) and NCA2 ($) determined by the USA regression formula (USRF). The area under the curve of the JRF (0.89) is larger than area under the curve of the USRF (0.82).
