
Figure 4.
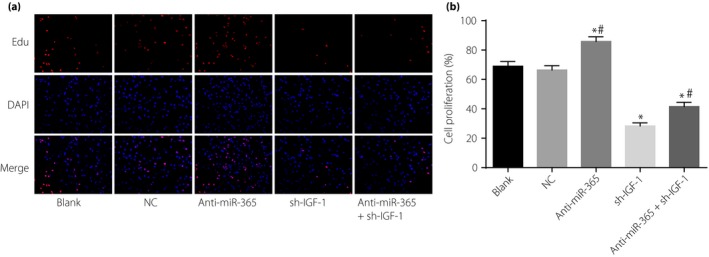
Proliferation of retinal neurons after transfection among five groups detected by EdU assay. (a) Detection of cell proliferation by 5‐ethynyl‐2′‐deoxyuridine (EdU) staining. (b) Cartogram of cell proliferation of each group. Red fluorescence in (a) were newly proliferated cells. *P < 0.05, compared with the negative control (NC) and blank groups; # P < 0.05, compared with the short hairpin ribonucleic acid plasmid (sh‐IGF‐1) group. DAPI, 4′,6‐diamidino‐2‐phenylindole; IGF‐1, insulin‐like growth factor‐1; miR‐365, micro‐ribonucleic acid‐365.