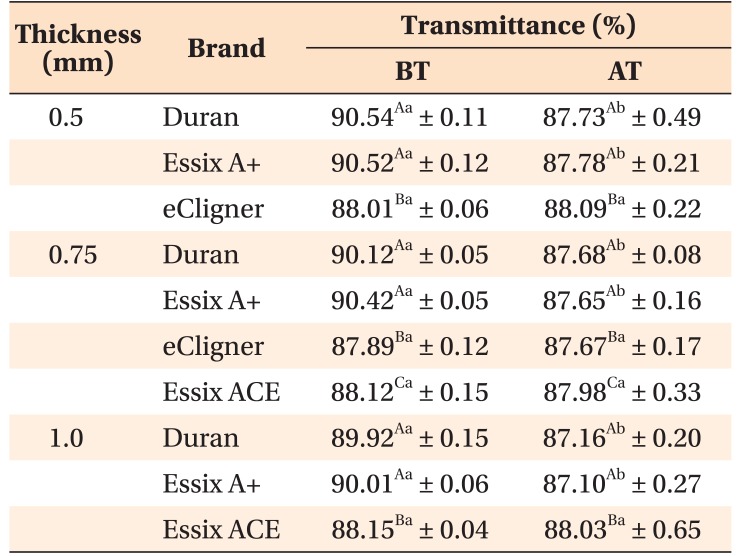
Table 2. Comparison of the transparency of different thermoplastic materials before thermoforming (BT) and after thermoforming (AT).
Values are presented as mean ± standard deviation.
A,B,CThe same capital letters in the vertical columns indicate no difference between materials at the 1% significance level. a,bThe same lower case letters in the horizontal rows indicate no difference between BT and AT at the 1% significance level.
See Table 1 for the manufacturer of each product.

