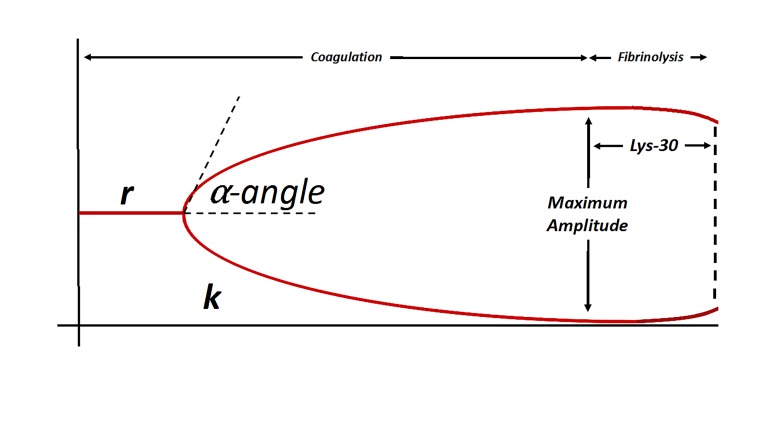
Figure 1.
Example of thromboelastogram analysis curve (adapted from Stravitz et al, 201226).
r – measured in minutes, the reaction time (r) represents the latency period between the initiation of the reaction and the initiation of fibrin formation, represented by k; k – measured in minutes, the kinetic time (k) represents the time required to reach a clot strength of 2mm; α-angle – measured in degrees, corresponds to kinetics of clot formation; a steeper angle corresponds to a more rapid rate of clot formation. Maximum amplitude – measured in mm, represents the maximum clot strength and is a function of both platelet count / function and fibrinogen concentration; Lys-30 – represents the rate of clot degradation in the 30-minute period following the achievement of maximum clot strength as represented by maximum amplitude.

