Figure 3.

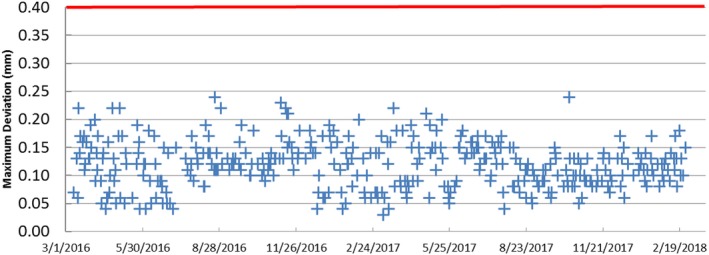
Maximum deviation (mm) in image volume of the daily CBCT precision test over 2‐yr period. The red line represents the manufacturer limit for the test to pass (0.4 mm).

Maximum deviation (mm) in image volume of the daily CBCT precision test over 2‐yr period. The red line represents the manufacturer limit for the test to pass (0.4 mm).