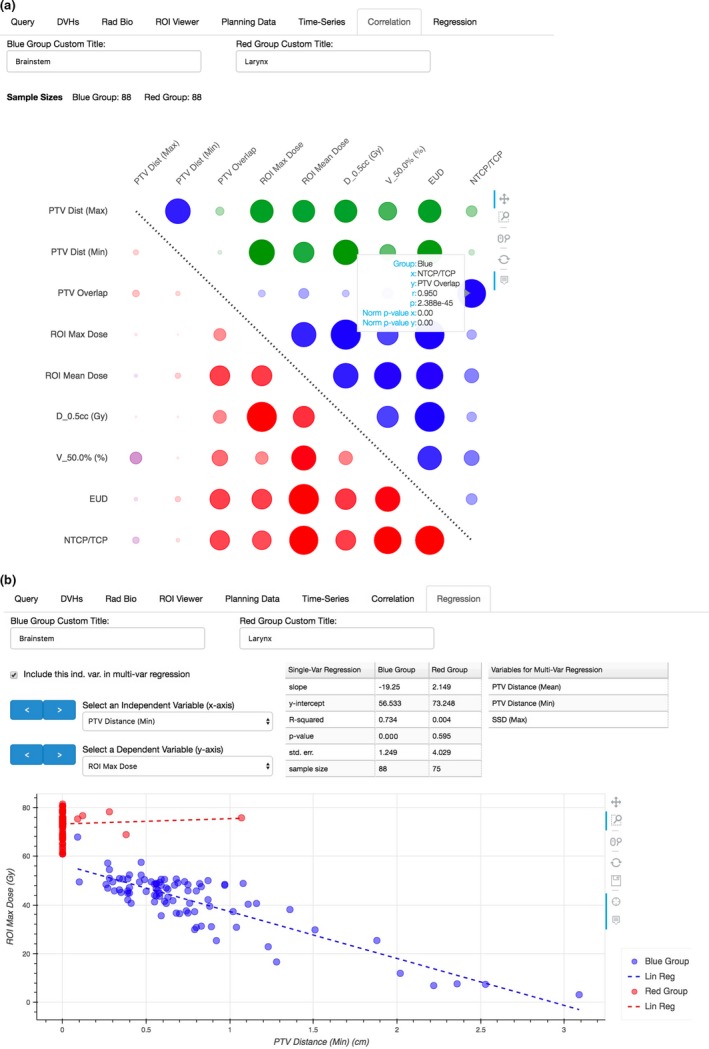
Figure 6.

A correlation matrix and linear regression of brainstem and larynx data from H&N plans. (a) The top right of the correlation matrix represents brainstem data (blue group), while the bottom left represent larynx data (red group). The diameter and opacity of each circle scale with the magnitude of the Pearson‐R correlation. Green and purple colors indicate negative correlations for brainstem and larynx data, respectively. (b) Univariable linear regression parameters are reported for both brainstem and larynx data. After inspection, the user may indicate which variables are to be included in a multivariable regression. The results of the multivariable regression with this brainstem data are tabulated in Table 3.
