
Figure 2.
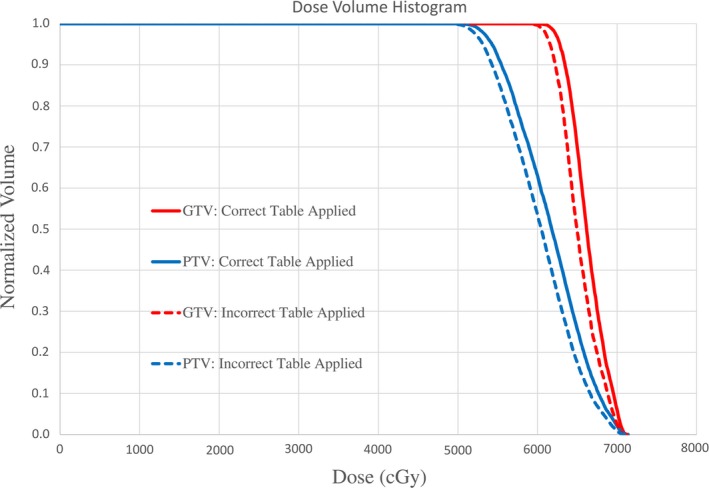
Example of the dosimetric impact of applying an incorrect CT‐density curve for dose calculation. PTV (blue) and GTV (red) DVH curves are shown for a lung SBRT patient. Discrepancies in D95 target coverage with the correct 120 kVp curve applied (solid lines) and incorrect curve applied (dashed lines) is ~3%.