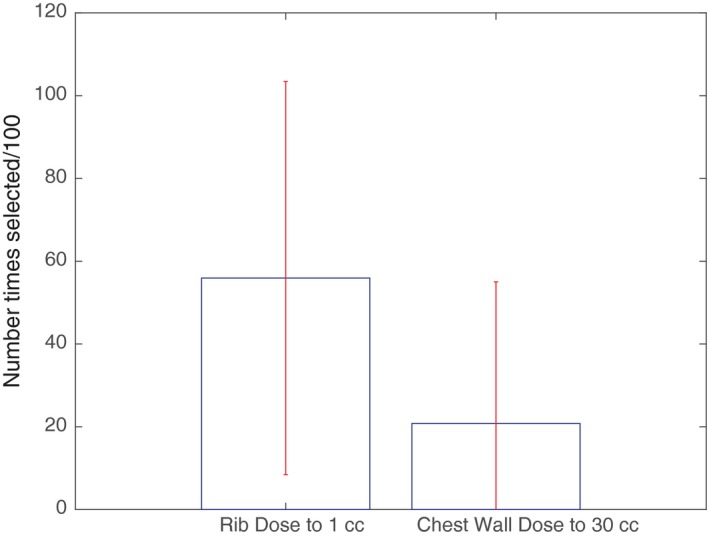
Figure 3.

Multivariate analysis using hyperparameter adjustment and multiple iterations. Number of times features selected for 100 iterations and different hyperparameters. Min Number per Node = 50–80. In each iteration, 10–40 patients (in increments of 2) were randomly left out to introduce variation on the resulting decision tree. Features with a mean value equal to 0.1 of the feature that is selected the most are shown. The top of each bar represents the number of times each feature is selected per 100 iterations. Error bars represent 1 SD.
