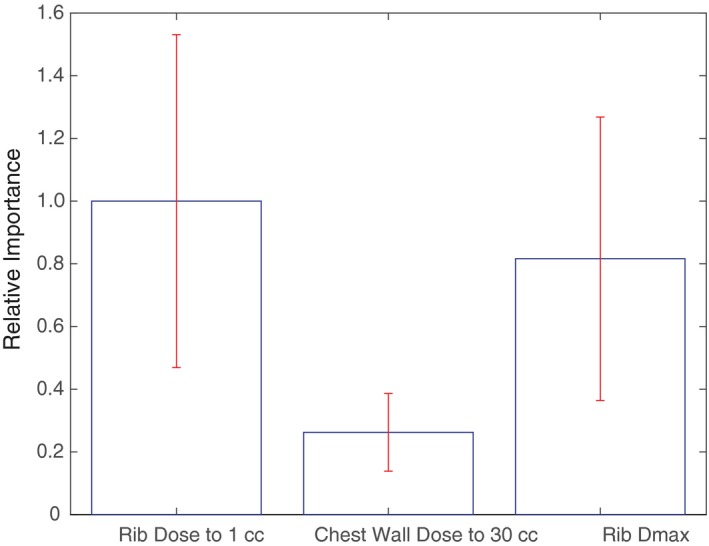
Figure 4.

Multivariate analysis using Random forests. Relative out‐of‐sample importance of different features calculating using Random forests. The top of the each bar represents the magnitude of out‐of‐sample importance for each feature. Error bars represent 1 SD.
