
Figure 6.
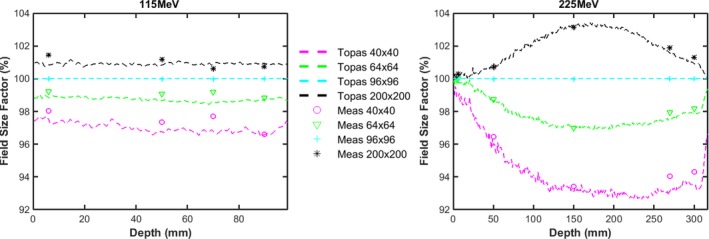
(a) and (b): Comparison of measured (markers) and TOPAS (dashed lines) FSFs dependence with depth in water, with the water phantom surface at isocenter for energies of 115 and 225 MeV (purple and “o” for 40 × 40 mm field size; green and “” for 48 × 48 mm; cyan and “+” for 96 × 96 mm field size; black and “*” for 200 × 200 mm field size).