
Figure 11.
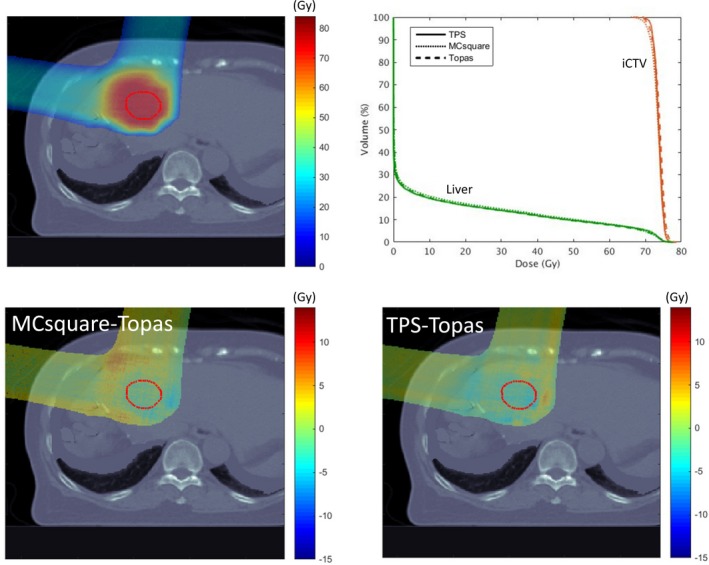
Recalculation of a liver treatment plan using TOPAS and MCsquare. (a) the dose color wash calculated by TOPAS, and (b), the DVH comparison for the three methodologies. Dose differences between MCsquare and TOPAS, and between TPS and TOPAS, are shown in a representative axial plane in (c) and (d), respectively. The visible structure is iCTV (red).