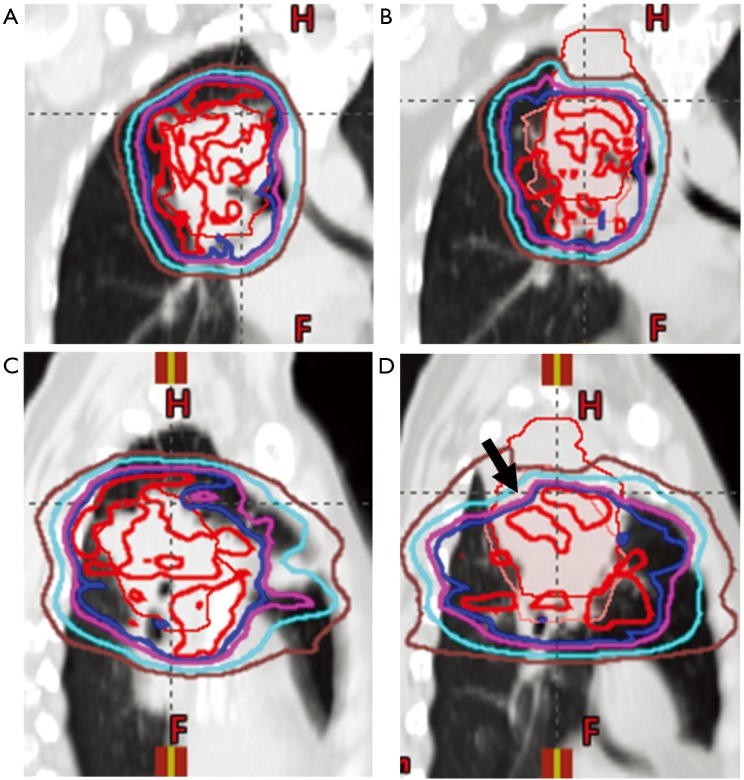
Figure 2.
Coronal (A,B) and sagittal (C,D) CT images of a patient planned for pencil beam scanning proton therapy for newly diagnosed LA-NSCLC. (A,C) CT simulation with delineation of GTV (thin red line) and radiation isodose lines (red: 100%, blue: 95%, purple: 90%, light blue: 75%, brown: 50%); (B,D) weekly quality assurance CT scan demonstrating consolidation and under-coverage of the superior aspect of initial target volume (arrow). For reference the original ITV location is outlined (thin pink line).

