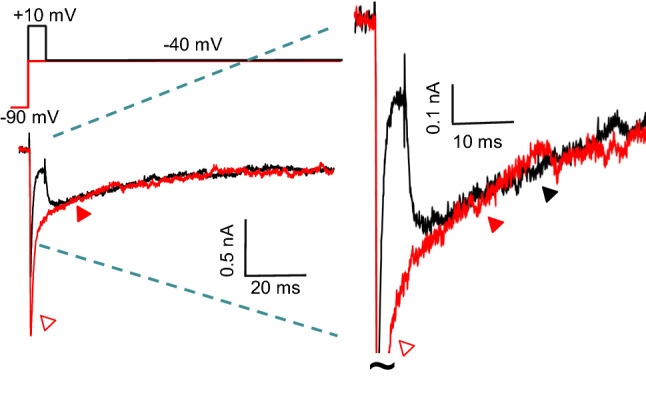
Fig. 4.

Decay phases of INaT and INaR. In the panel on the left, Nav current waveforms recorded from an isolated neonatal Purkinje neuron during two different voltage-clamp paradigms are shown; the voltage-clamp paradigms are illustrated above the current records. In the first case, membrane depolarization to − 40 mV from a holding potential (HP) of − 90 mV (red) evoked INaT (red); note the fast (red, open arrow) and slow (red, filled arrow) components of inactivation of INaT. Membrane repolarization to − 40 mV following a brief (5 ms) strong (+ 10 mV) depolarization from the same HP revealed INaR (black). Note that the time course of INaR decay (black, filled arrow) and the slow component of INaT inactivation (red, filled arrow) are indistinguishable. The currents are shown on expanded amplitude and time scales in the records shown in the panel on the right
