
Figure 2:
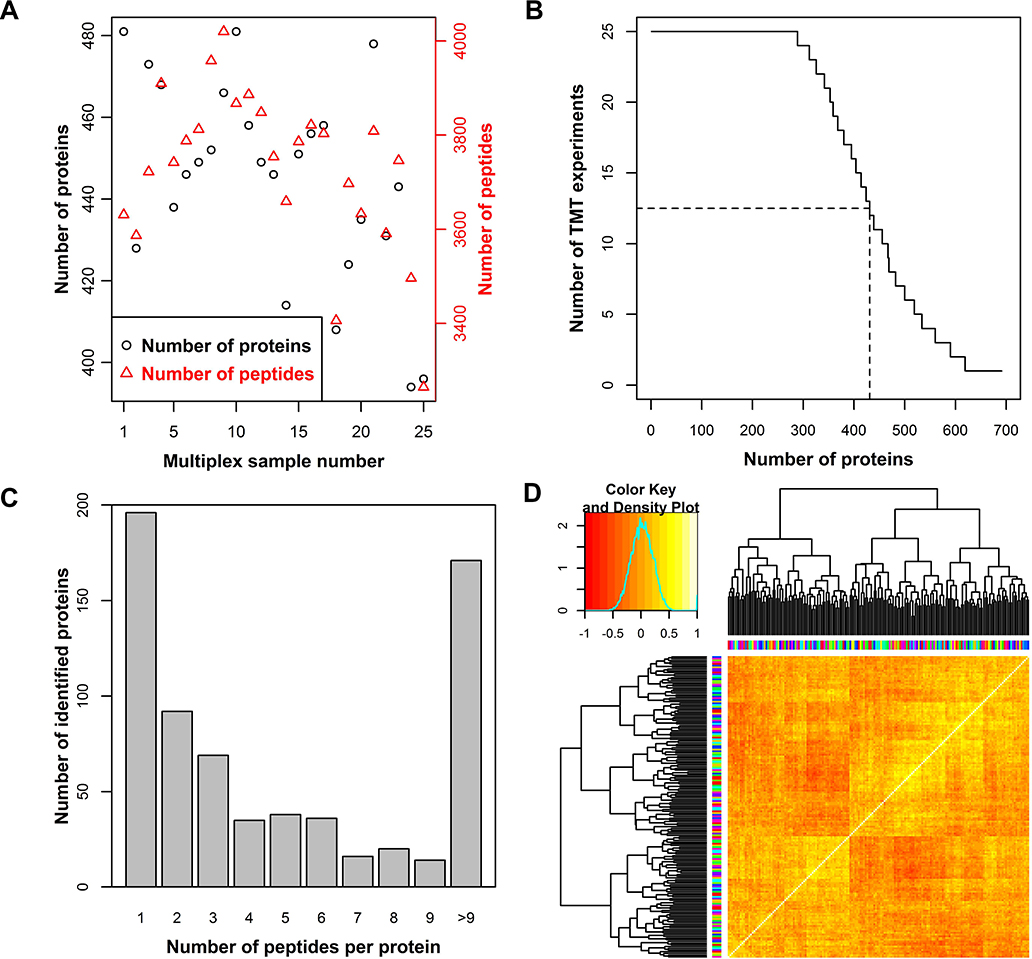
Number of peptides (red) and proteins (black) identified in each multiplex sample. The sum of identifications in two technical replicates is shown (A). The number of proteins identified in a given number of multiplexed experiments. The dashed lines indicate identification in half of the TMT reactions (B). The number of proteins identified by a given number of peptides. For each protein, the sum of peptides across the dataset is provided (C). Heatmap of Spearman’s correlation clustering for the study summarized in Table 1. Colors on axis indicate TMT label (vertical) and multiplex sample number (horizontal) (D).