
Figure 3:
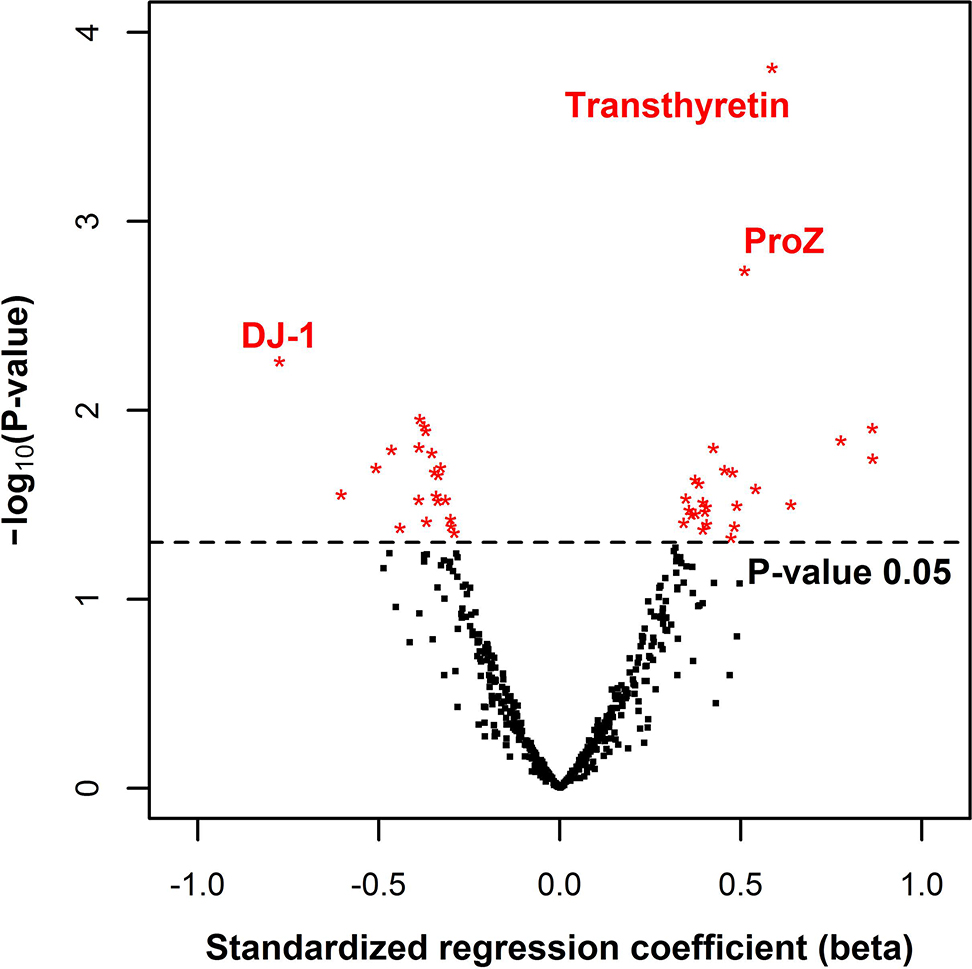
Volcano plot of plasma proteins identified in 40 or more samples. For each protein, the standardized regression coefficient for VTE status is plotted against -log10(p-value). The multivariate model included age, sex, and BMI as covariates. The black dashed line indicates a p-value of 0.05. The three candidates with the lowest p-values are indicated by their protein name. Abbreviations: ProZ = vitamin K-dependent protein Z, DJ-1= Protein/nucleic acid deglycase DJ-1.