
Figure 6:
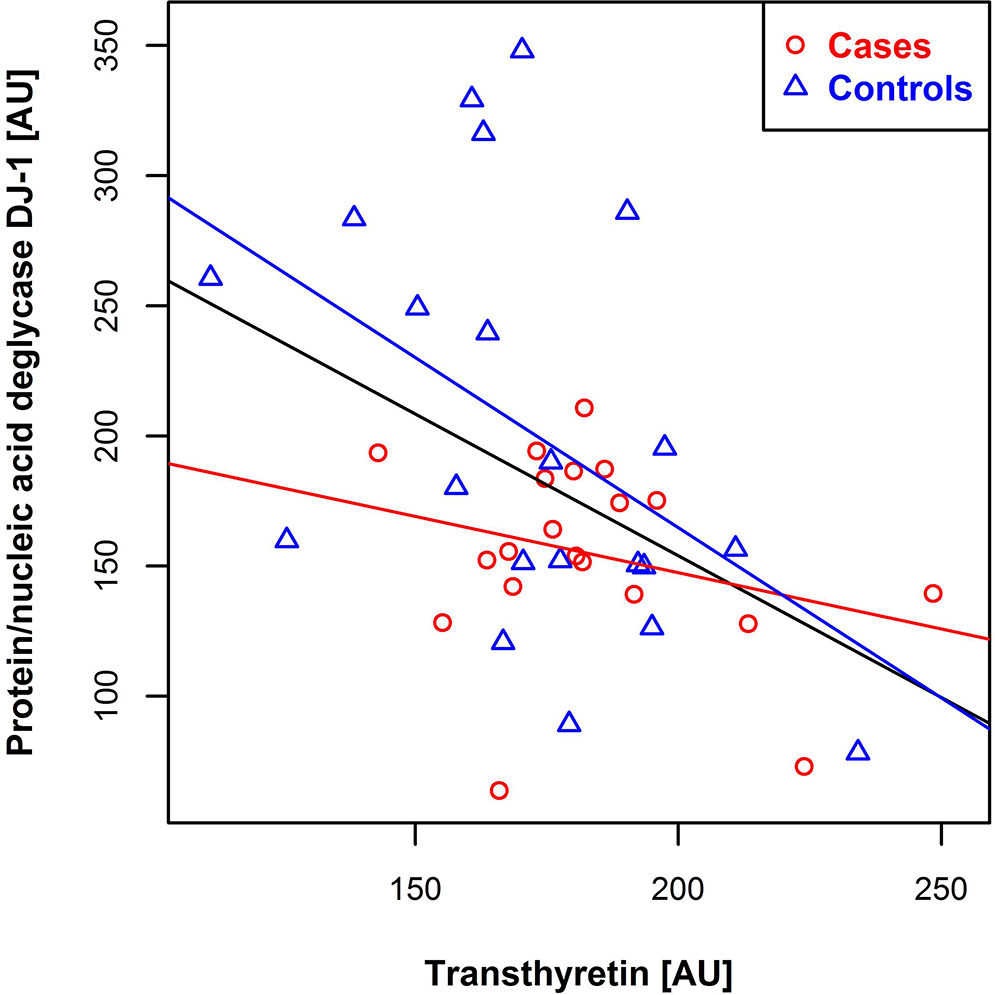
Scatter plot of relative transthyretin levels versus protein/nucleic acid deglycase DJ-1 levels. Controls are shown in blue and cases in red, with corresponding regression lines. The black regression line is created with respect to all samples. Abbreviation: AU = arbitrary units.