
Figure 7:
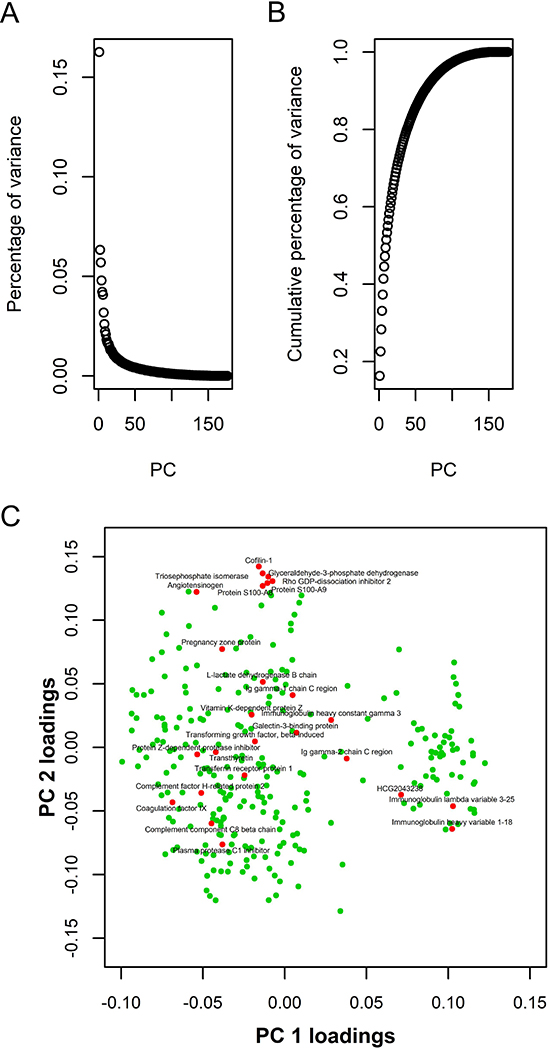
Principal component (PC) analysis. Panel A shows the percentage of variation explained by each PC. Panel B shows the cumulative percentage of variance explained by PCs. Panel C shows a scatterplot of the loadings for PC1 and PC2 of the each protein. Candidate biomarkers are shown in red. All other proteins in the PC analysis are shown in green. Abbreviation: PC = principal component.