
Figure 2.
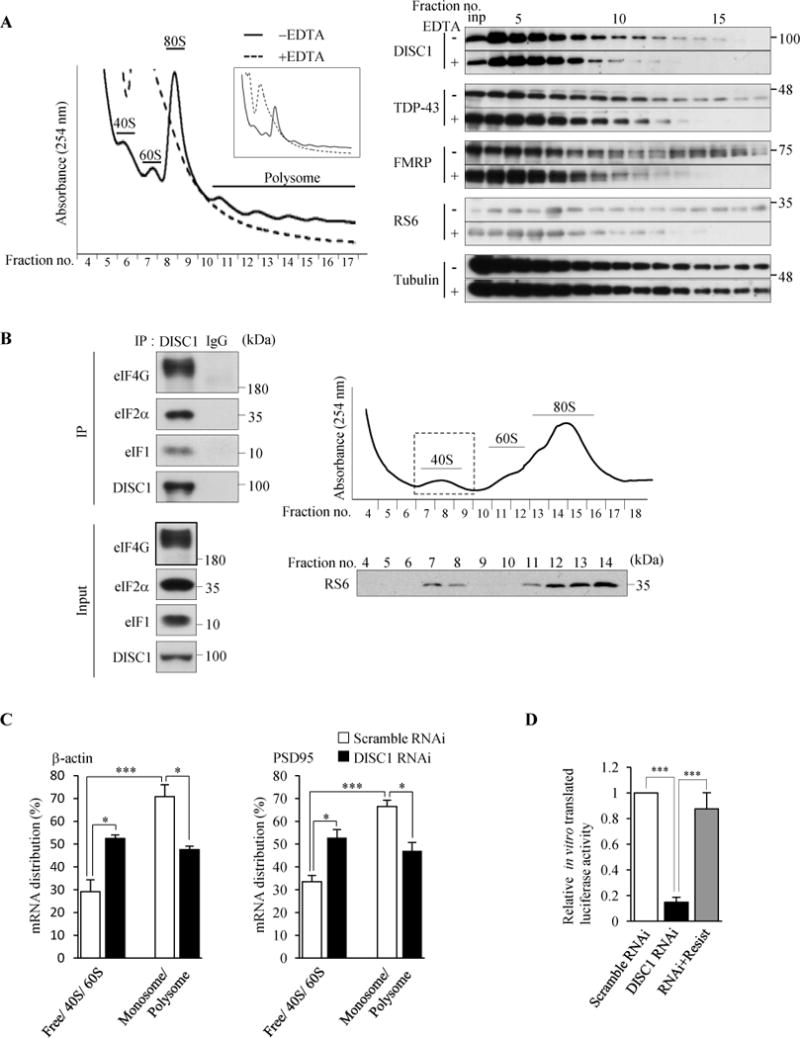
DISC1 binds to initiation factors and regulates translation initiation. (A) The polysome gradient analysis using lysates of cultured cortical neurons that were treated with or without 30 mM EDTA prior to centrifugation. A representative absorption profile of sucrose gradient at 254 nm is shown (left). The inset shows the overall view of the absorption profile. Fractions were collected and analyzed by western blotting with indicated antibodies (M49 for DISC1) (right). DISC1 showed the co-migration with polysomes both before and after the EDTA treatment. “inp” denotes input. (B) DISC1 binds to eIF4G, eIF2α and eIF1 in the 40S ribosome fraction. DISC1 was immunoprecipitated (m595C) from 40S ribosome fractions purified from wild-type mouse cerebral cortex, followed by western blotting. The right top panel shows the absorption profile of sucrose gradient at 254 nm and the collected fractions were analyzed by western blotting with an anti-RS6 antibody. (C) Ribosome-free (Free), 40S, 60S, 80S monosome and polysome fractions were obtained from N2a cell lysates by sucrose gradient centrifugation. mRNA levels of β-actin and PSD95 in each fraction were analyzed by RT-qPCR. The percentages of mRNA distribution in Free + 40S + 80S and monosome + polysome fractions are shown. (n=3, β-actin: F(3,8)=19.85, P=0.0005; PSD95: F(3,8)=18.68, P=0.0006, one-way ANOVA, *P<0.05, ***P<0.001 Bonferroni’s multiple comparison test post hoc). (D) In vitro translation using N2a cell lysates. In vitro transcribed mRNA encoding Gaussian luciferase (Gluc) driven by the m7GpppG cap structure was added to cell lysates and incubated for 5 hours followed by measurement of luciferase activity. The luciferase activity of in vitro translated Gluc is expressed as the relative ratio to control cells (n=4, F(2,9)=36.46, P<0.0001, one-way ANOVA; *P<0.05, ***P<0.001, Bonferroni’s multiple comparison test post hoc). Throughout the figures, error bars represent S.E.M.