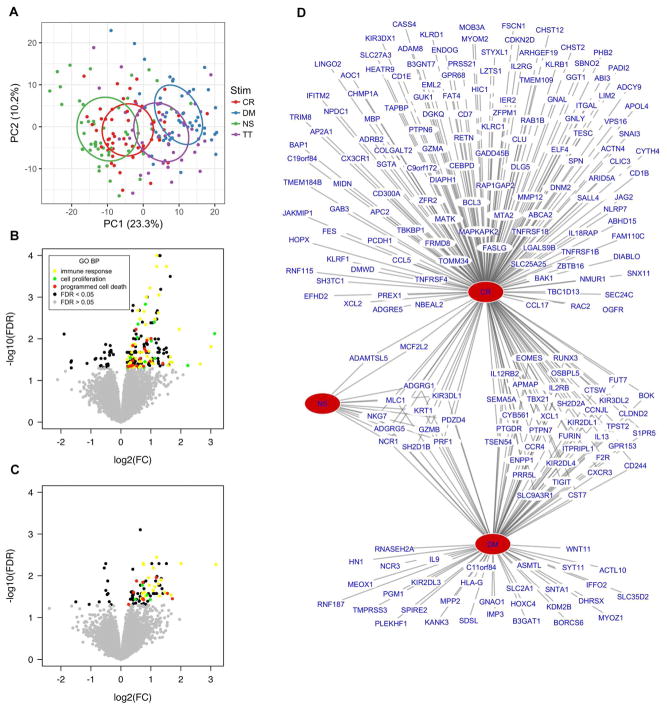
Fig. 2. Allergen stimulation of PBMCs leads to robust gene expression changes.
(A) Stimulus accounts for the greatest source of gene expression variability in PBMCs by PCA. Ellipses represent 95% confidence intervals. (B) CR-Early individuals demonstrated significant differences in expression of 206 genes in response to CR stimulation compared to Neither (FDR<0.05). (C) DM-Early individuals demonstrated significant differences in expression of 91 genes in response to DM stimulation compared to Neither (FDR<0.05) (Stimulation linear modeling with fixed effects for site, gender, blood draw year, home allergen levels, and stimulation and random effect for individual; nCR-Early = 16, nDM-Early = 13, nNeither = 30). Differentially expressed genes in both comparisons are enriched for similar GO BP pathways. (D) Significantly upregulated genes in the Early group in NS, CR, and DM stimulated samples show a high degree of overlap as depicted in a bipartite network (P=3.6E-75; Fisher’s exact test, CR and DM upregulated genes).

