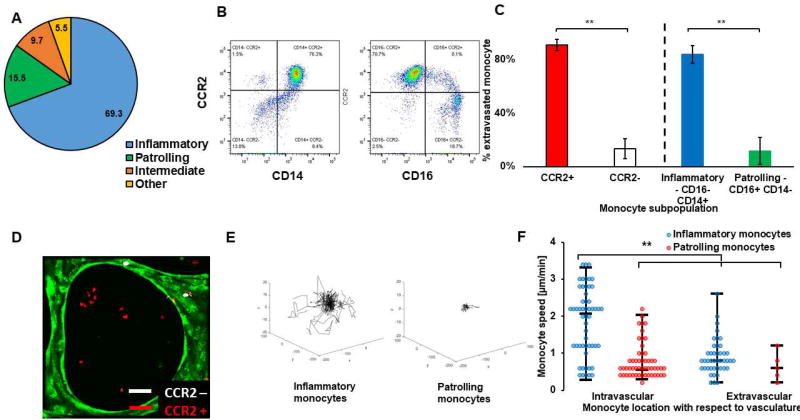
Figure 2. Inflammatory CCR2+ monocytes but not patrolling or CCR2- monocytes extravasate in our assay, mimicking in vivo behavior.
A) Pie chart showing the average percentage of the different monocyte subpopulations in blood samples from N=7 donors. B) Representative flow cytometry plot, showing the percentage of CCR2+ or – monocytes that are either CD16+/− or CD14+/−, showing there is a large overlap between CCR2+ monocytes and inflammatory monocytes (CD14+ CD16−) and between CCR2- and patrolling monocytes (CD14−CD16+). C) Percentage of subpopulation of monocytes found in the extravascular space 2–3 days following monocytes perfusion inside the microvascular network. In one set of experiments, monocytes were sorted into inflammatory (CD14+ CD16−, blue) or patrolling (CD14− CD16+, green) monocytes, while in another set of experiments, monocytes were sorted into CCR2 positive (CCR2+, red) or CCR2 negative (CCR2, white). N=3 devices, N=3 donors. Bars are SEM. D) Confocal projection image of CCR2+ and CCR2- monocytes perfused together in a microvascular network. CCR2- monocytes (white) were typically found inside the vessels, while CCR2+ (red) had a much higher tendency to extravasate and be found in the extravascular space. E) Representative trajectories of either inflammatory or patrolling monocytes during their intravascular migration. F) Speed of inflammatory (blue) vs. patrolling (red) monocytes found intravascularly or extravascularly one day following perfusion in the microvascular networks. Each point corresponds to one monocyte. N=47–61 cells, N=3 devices, N=3 donors.

