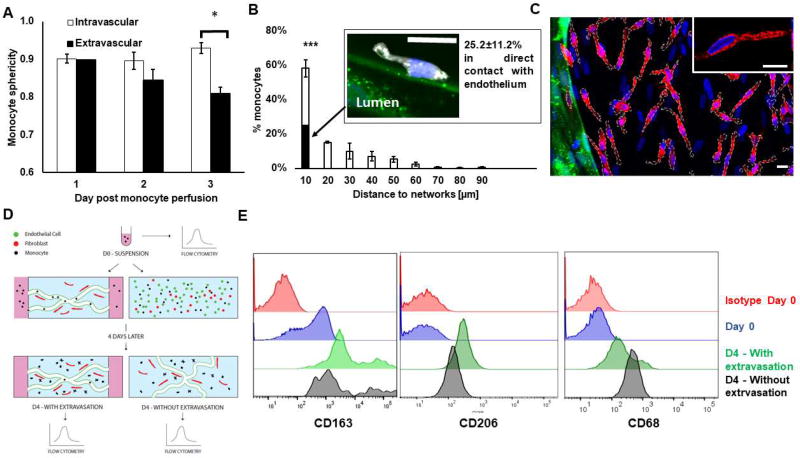
Figure 4. After extravasation, monocytes slow down, stay perivascular and become macrophage-like.
A) Sphericity of intravascular vs. extravascular monocytes over time following their perfusion in the microvascular networks. B) Histogram showing the distribution of monocyte with respect to their minimum distance to the endothelium wall. The filled portion of the bar shows the percentage of monocytes that are in direct contact with endothelium. N= 3–8 devices, N= 3 donors. The confocal microscopy image shows a perivascular monocyte (white) following its extravasation (nucleus stained with DAPI in blue) in direct contact with endothelium (green). N= 3–8 devices, N= 3 donors. Bar is 10 µm. C) Representative confocal image showing monocytes after transmigrating through vascular network (green) stained with CD206 (red). Nuclei are shown in blue (DAPI). Monocytes membranes are surrounded by white dashes. Note that there are also fibroblasts in the extravascular space, which correspond to the nuclei that are not part of a cell overlaid with white dashes. Bars are 10 µm. D) Diagram describing experiment to characterize monocyte differentiation status over time. Macrophage-like markers CD68, CD163 and CD206 were analyzed with flow cytometry on monocytes at different time points: immediately after blood isolation; or four days later, after the monocytes were either introduced in the vascular networks, allowed to extravasate, and retrieved for analysis or mixed with endothelial cells and fibroblasts in a 3D fibrin gel to expose them to the same micro-environment factors but without giving the monocytes a chance to extravasate. E) Representative flow cytometry tracings corresponding to experiment just described for CD68, CD163 and CD206.

