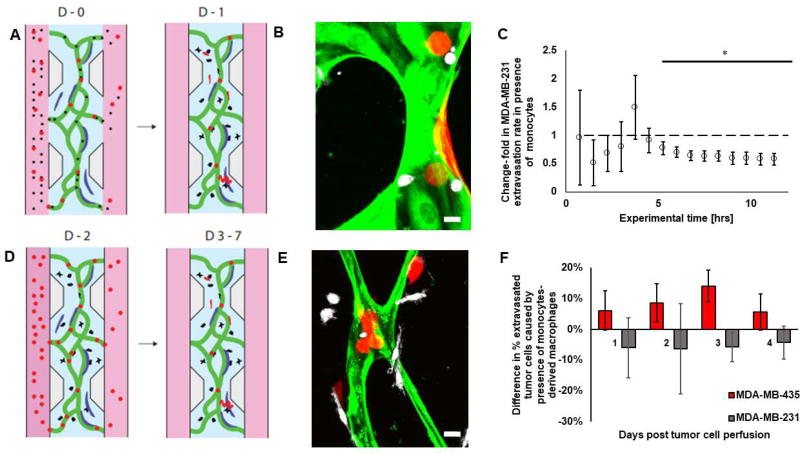
Figure 6. Tumor cell extravasation is affected by monocytes before the monocytes transmigrate through the vessels.
A) Diagram of the experiments performed with monocytes (black) perfused in the microvascular network (green) directly with the tumor cells (red). In this diagram, fibroblasts are shown in blue. B) Corresponding confocal image. Monocytes are in white, tumor cells in red, endothelial cells in green; fibroblasts not visible. Bar is 10 µm. C) Change in extravasation rate of MDA-MB-231 tumor cells caused by the presence of monocytes. Bars are SEM. D) Diagram of the experiments performed with monocytes (black) after they transmigrated through the microvascular networks. In these experiments, monocytes were first perfused on their own in the microvascular networks as previously described (Fig. 1A) – two days later, most of them had crossed the endothelium, at which point the tumor cells were perfused in the microvascular networks. In this diagram, fibroblasts are shown in blue. E) Corresponding confocal image. Monocytes are in white, tumor cells in red, endothelial cells in green; fibroblasts not visible. Bar is 10 µm. F) Quantification of the change in tumor cell extravasation (MDA-MB-231 in grey, and MDA-MB-435 in red, separate experiments) caused by the presence of monocyte-derived macrophage. For MDA-MB-435, 167–343 cells in 7–12 devices were analyzed per condition per day. For MDA-MB-231, 77–285 cells in 2–6 devices per condition were analyzed per day. Bars are SEM.

