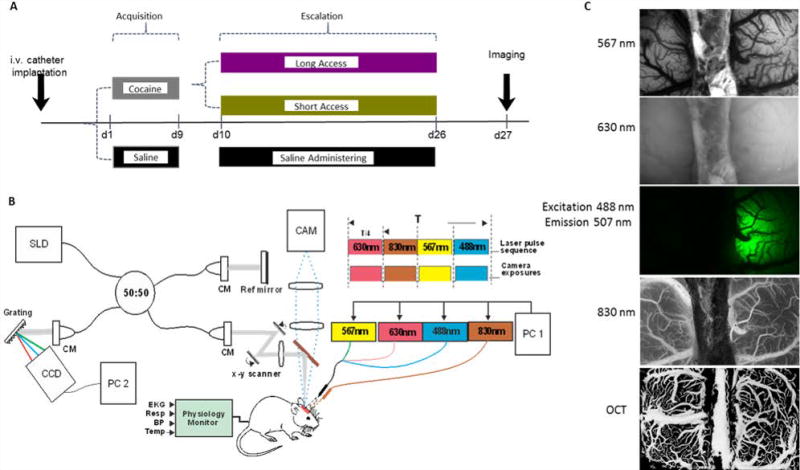
Figure 1.
Panel A displays a diagram of the experimental design. After catheter implantation, rats were divided into cocaine self-administering or saline administering (naïve) groups. The cocaine administering group was further subdivided into ShA and LgA groups for the escalation period. All animals underwent the window implantation and imaging 24hrs after their last session and received a cocaine infusion during imaging. Panel B shows a schematic diagram of the OCT system (left; CM, collimator; BBS, broadband source (λ ¼ 1.3 µm)) and MW-LSI (right) with 4 alternating light sources. Panel C shows representations of images produced from OCT and the 567, 630, 488, and 830 nm wavelengths of the MW-LSI system.

