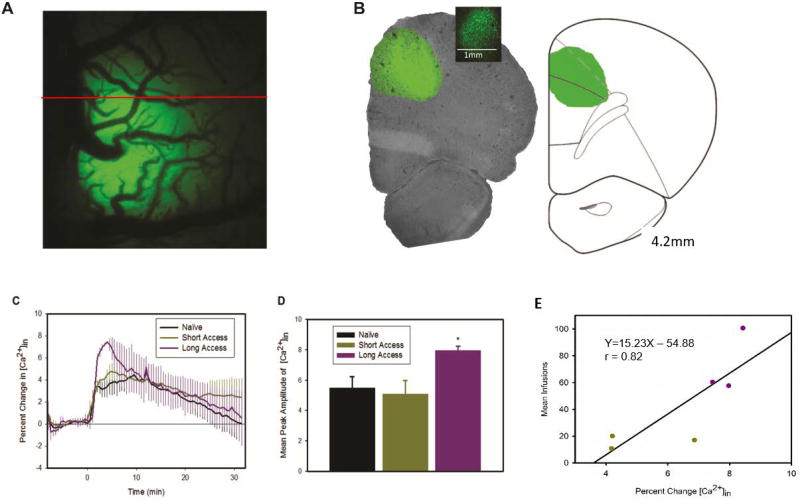
Figure 5.
GCaMP6f fluorescence showing enhanced response to 1mg/kg cocaine infusion in LgA rats. Panel A shows a representative surface image of the unilateral expression of GCaMP6f, the red line indicates approx. position of slice. Panel B shows a coronal slice displaying location of expression in the anterior cingulate cortex and the dorsal portion of the prelimbic cortex; the inset is a magnified slice showing cellular expression. Panel C shows the time course of fluorescence change resulting from a cocaine infusion at time 0. Panel D shows the mean peak amplitude of fluorescence for each group. Planned comparisons show that LgA have a significantly larger increase than in naïve rats (p<0.05). Panel E shows correlation between maximal [Ca2+]in and the number of infusions obtained at the end of the self-administration period (day 25), with the regression equation and r value displayed.

