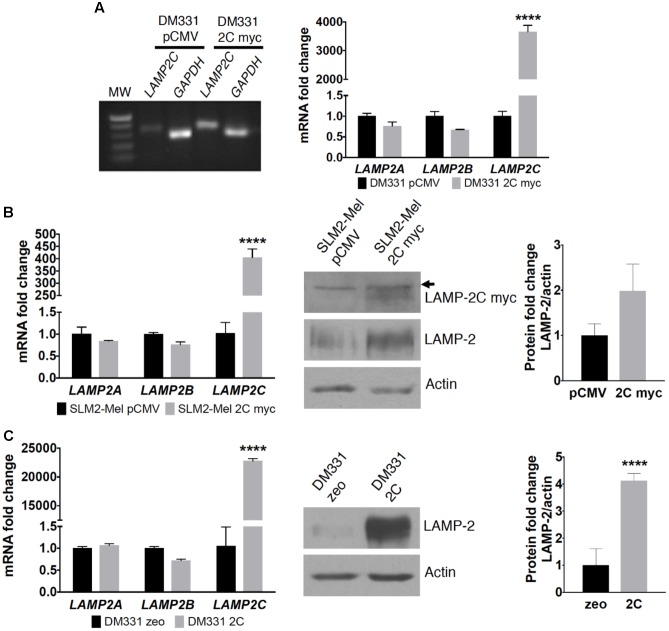
FIGURE 2.
LAMP-2 expression in human melanoma cell lines transfected with LAMP-2C. (A) DM331 cells were transfected with an empty vector (pCMV) or a plasmid encoding for C-terminal myc tagged LAMP2C. RT-PCR analysis for LAMP2C overexpression was detected in an agarose gel. mRNA levels of LAMP2A, LAMP2B, and LAMP2C transcripts were analyzed by qPCR and normalized to 18S expression. To detect relative changes in the expression of each isoform, the normalized expression of each isoform was set equal to one in DM331 pCMV cells. (B) SLM2-Mel cells were transfected with an empty vector (pCMV) or a plasmid encoding for C-terminal myc tagged LAMP2C. mRNA levels of LAMP2A, LAMP2B, and LAMP2C in these cells were analyzed by qPCR and normalized to ACTB expression. The relative expression of each isoform was set equal to one for SLM2-Mel pCMV control cells. Cell lysates were probed for the c-myc tagged LAMP2C or total LAMP2 protein with actin used as a control for sample loading. Arrow indicates non-specific protein band detected with anti-myc antibody. (C) DM331 cells were transfected with an empty vector (zeo) or a plasmid encoding for LAMP2C with no tag sequence. mRNA levels of LAMP2A, LAMP2B, and LAMP2C in these cells were analyzed by qPCR and normalized to GAPDH expression. To examine relative changes in each isoform, the expression of individual isoforms was set to one for the DM331 zeo control cells. Cell lysates were probed for total LAMP2 protein with actin used as a control for sample loading. Data were analyzed by two-way ANOVA or by two-tailed, unpaired Student’s t-test. ∗∗∗∗p < 0.0001 (n = 2–3).

