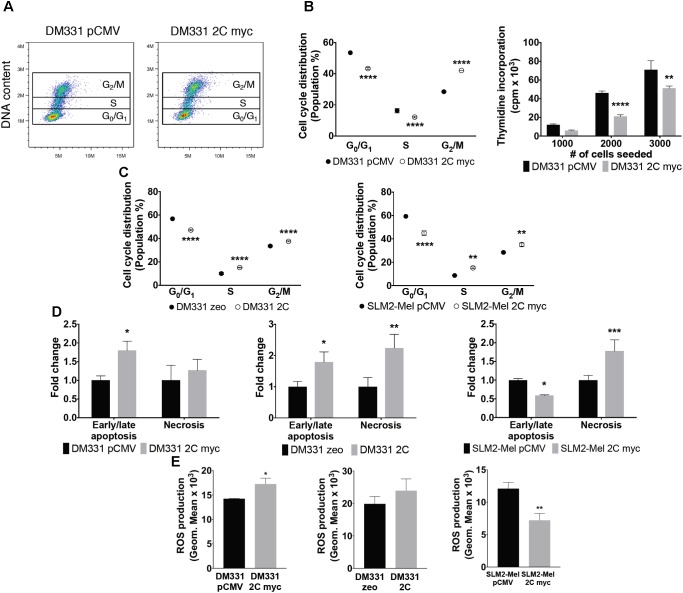
FIGURE 7.
Reduced survival and altered cell cycle in melanomas expressing LAMP-2C. (A) Apoptosis and necrosis were examined by incubating DM331 pCMV and DM331 2C myc cells with a fluorogenic substrate specific for activated caspase-3 and caspase-7 in apoptotic cells and AAD dead cell stain to detect necrotic cells. Apoptotic and necrotic cells were detected by flow cytometry. (B) Representative dot plot graph of the cell cycle distribution of DM331 pCMV and DM331 2C myc cells. Cell cycle distribution was evaluated by staining DNA content of DM331 pCMV and DM331 2C myc cells with propidium iodide and quantified by flow cytometry. (C) Cell cycle distribution of DM331 zeo and DM331 2C was evaluated by staining DNA content with propidium iodide and quantified by flow cytometry. (D) Cell cycle distribution was analyzed by staining the DNA content of SLM2-Mel pCMV and SLM2-Mel 2C myc with propidium iodide and detected by flow cytometry. (E) To examine basal ROS production, melanomas with and without ectopic LAMP-2C expression were incubated for 30 min at 37°C with 5 μM CellROX Deep Red Reagent and monitored by flow cytometry. Data were analyzed by two-way ANOVA or by two-tailed, unpaired Student’s t-test. ∗p < 0.05, ∗∗p < 0.01, ∗∗∗p < 0.001, and ∗∗∗∗p < 0.0001 (n = 2–3).

