FIGURE 9.
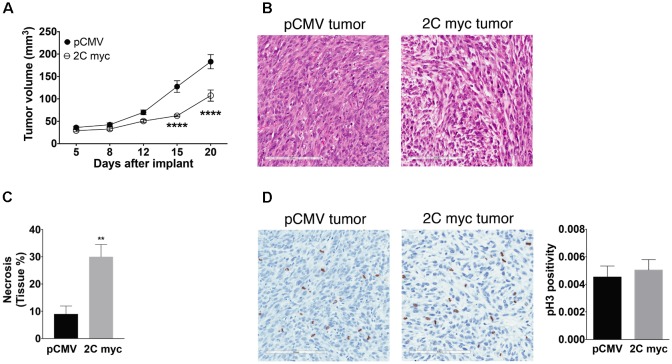
Ectopic expression of LAMP-2C decreased tumor growth in a xenograft mouse model. NSG mice were implanted subcutaneously in the flanks with 5 × 10⁵ DM331 cells with or without ectopic LAMP-2C myc expression. (A) Tumor growth was monitored biweekly (n = 13 per group). (B) Representative HE staining of primary control tumor or primary tumor with high ectopic expression of LAMP-2C myc. (C) Percentage of necrotic areas of primary tumors were evaluated by HE staining (n = 5 per group). (D) Representative pH3 staining of primary tumor with or without LAMP-2C myc expression. To determine changes in mitosis, pH3 positive cells were quantified in five hot spots areas of primary tumors. pH3 positivity was quantified dividing the number of pH3 positively stained cells by the total number of cells in the selected areas (n = 6 per group). Data were analyzed by two-way ANOVA or by two-tailed, unpaired Student’s t-test. Error bars indicate mean ± SEM. ∗∗p < 0.01 and ∗∗∗∗p < 0.0001.

