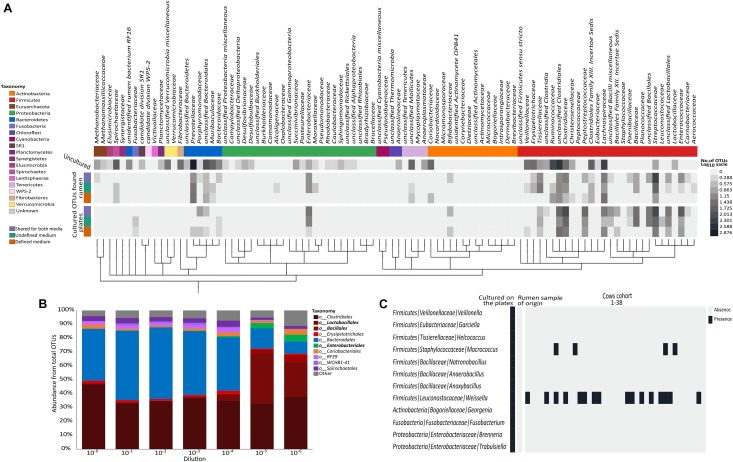
FIGURE 2.
Distribution of the cultured OTUs across rumen microbiome taxonomy and structure. (A) Heat map describing the number of OTUs (in log scale) annotated to phylogenetic groups detected in each of the examined datasets. From top to bottom (color coding indicated on the left side of the figure): OTUs detected only in the original rumen sample, OTUs detected on both media and in the original rumen sample, OTUs detected on the undefined medium and in the rumen sample, OTUs detected on the defined medium and in the rumen sample, OTUs detected on both media, OTUs detected only on the undefined medium, and OTUs detected only on the defined medium. OTUs were arranged on a phylogenetic tree that was created by phyloT program using NCBI accession numbers for each phylogenetic group. The tree was visualized using iTOL online tool (Letunic and Bork, 2016). (B) Stacked bar plot describing the relative abundance at the order level of the original rumen sample and its dilutions. (C) Heat map describing the distribution of the cultured OTUs belonging to the rare biosphere across 38 rumen microbiomes. Taxonomic annotations are given as phylum/family/genus.

