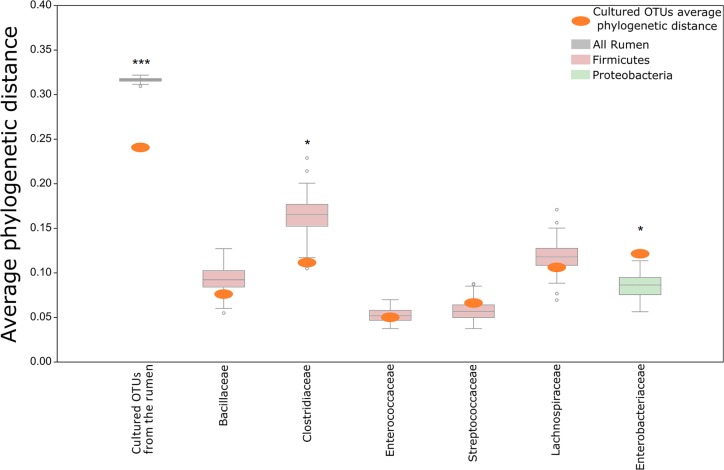
FIGURE 3.
Comparison of the phylogenetic distances between OTUs growing on the plates and OTUs detected in the original rumen sample. The mean phylogenetic distances between OTUs that grew on plates was calculated and compared to the distribution of phylogenetic distances between the OTUs of the original rumen sample. The distribution of distances from the rumen OTUs is illustrated as a box plot. The average phylogenetic distance between OTUs of the cultured reference group being compared to this rumen distribution is illustrated as an orange oval. The distribution of phylogenetic distances was calculated from a rumen OTU subset picked randomly in a sample size depending on the cultured OTU reference group. Permutation = 100. The following numbers of rumen OTUs were picked for each category (according to the x-axis): All = 1,012; Bacillaceae = 6, Clostridiaceae = 6, Enterococcaceae = 6, Lachnospiraceae = 6, Streptococcaceae = 6, Enterobacteriaceae = 6. Asterisks mark in which cases the average phylogenetic distance of the cultured OTUs differs from the average distance of uncultured OTUs. ∗Cultured OTUs are above/below the 10th percentile. ∗∗∗Cultured OTUs are below the 1st percentile.

