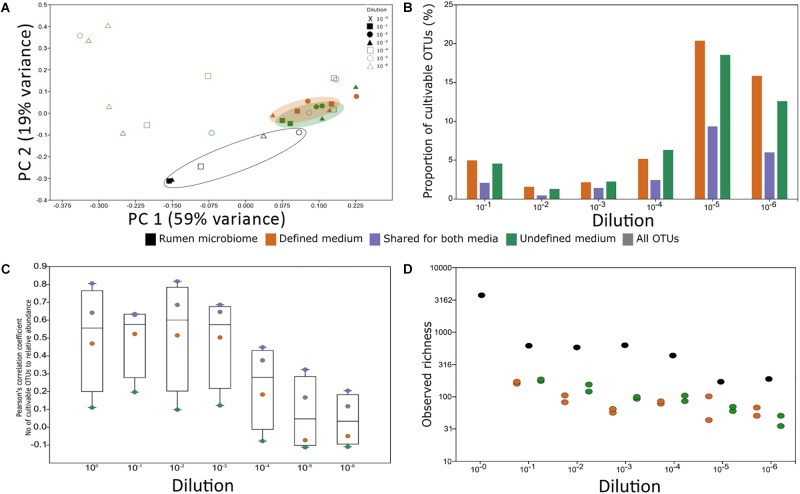
FIGURE 4.
Experimental factors affecting cultivability. (A) PCoA of rumen samples and their cultivable microbial consortia. The variance explained by each component is indicated on each axis. (B) Proportion of the cultivable microbiome in each rumen dilution. The proportion was calculated as the number of OTUs found in both the rumen dilution and its matching plate. The x-axis denotes the dilution of the sample. There was no statistical difference between the proportions of OTUs growing on defined and undefined media (Wilcoxon rank sum test, P > 0.05). (C) The impact of abundance on cultivability. Pearson’s correlation coefficient of the number of cultivable OTUs in each percentile and the relative abundance in each percentile was calculated. Correlations above | r| = 0.3 and P < 0.05 after Holm–Bonferroni correction were considered significant. The y-axis represents Pearson’s correlation coefficient result and the x axis represents the dilution. The numbers of cultivable OTUs were divided according to the medium in which they were found (green – OTUs unique to undefined medium, orange – OTUs unique to defined medium, purple – OTUs found on both medium types, and gray – total number of OTUs). (D) Observed richness for rumen samples and microbial consortia from the plates in each medium type. The overall difference between groups was significant as determined by Kruskal–Wallis test (P = 0.01564). Wilcoxon rank sum paired test (P-value Holm–Bonferroni correction): rumen vs. defined medium: P = 0.03125; rumen vs. undefined medium: P = 0.03125 from each plate in each medium type. Colors represent sample source: Black – rumen samples, orange – microbial consortium that grew on defined medium, and green – microbial consortium that grew on undefined medium. X-axis denotes the dilution of the sample.

